

 The Sonas Rating Formula – Better than Elo?
Every three months, FIDE publishes a list of chess ratings for thousands of players around the world. These ratings are calculated by a formula that Professor Arpad Elo developed decades ago. This formula has served the chess world quite well for a long time, but I believe that the time has come to make some significant changes to that formula.
At the start of August, I participated in a four-day conference in Moscow about rating systems, sponsored by WorldChessRating. One of the conclusions from this conference was that an extensive "clean" database of recent games was needed, in order to run tests on any new rating formula that was developed. In subsequent weeks, Vladimir Perevertkin collected the raw results from hundreds of thousands of games between 1994 and 2001, and I have imported that information into my own database for analysis.
I have experimented with lots of different rating formulas, generating historical ratings from 1994-2001 based upon those formulas. For instance, we can see what would have happened if all of the blitz and rapid games were actually included in the rating calculation, or if different coefficients within the formulas were adjusted. All of the following suggestions are based upon that analysis
I believe that the basic FIDE rating formula is sound, but it does need to be modified. Instead of the conservative K-Factor of 10 which is currently used, a value of 24 should be used instead. This will make the FIDE ratings more than twice as dynamic as they currently are. The value of 24 appears to be the most accurate K-Factor, as well. Ratings that use other K-Factors are not as successful at predicting the outcomes of future classical games.
Elo's complicated table of numbers should be discarded, in favor of a simple linear model where White has a 100% expected score with a 390-point (or more) rating advantage, and a 0% expected score with a 460-point (or more) rating disadvantage. Other expected scores in between can be extrapolated with a simple straight line. Note that this assigns a value of 35 rating points to having the White pieces, so White will have an expected score of 50% with a 35-point rating deficit, and an expected score of 54% if the players' ratings are identical. This model is far more accurate than Elo's table of values. Elo's theoretical calculations do not match the empirical data from actual results, and do not take the color of pieces into account either. They also show a statistical bias against the higher-rated players.
Classical games should be given their normal importance. Games played at the "modern" FIDE control are not as significant, and thus should only be given an 83% importance. Rapid games should be given a 29% importance, and blitz games an 18% importance. The choice to rate these types of games will actually improve the ratings' ability to predict the outcome of future classical games. By using these particular "weights", the ratings will be more accurate than if rapid and blitz games were completely excluded. The exact values of 83%, 29%, and 18% have been optimized for maximal accuracy and classical predictive power of the ratings. If you prefer a more exact definition that recognizes different types of rapid controls, or one that incorporates increments, I have included a graph further down which allows you to calculate more precise coefficients for arbitrary time controls.
There is no reason why rating lists need to be out of date. A monthly interval is quite practical, considering that the calculation time for these ratings is almost negligible. The popularity of the Professional ratings shows that players prefer a more dynamic and more frequently-updated list.
In some ways, the Elo approach is already very simple. Whenever a "rated" game of chess is played, the difference in FIDE ratings is checked against a special table of numbers to determine what each player's "predicted" score in the game should be. If you do better than that table predicts, your rating will increase by a proportionate amount. If you do worse than "predicted", your rating will decrease correspondingly.
Let's say, for instance, that you have a rating of 2600, and you play a 20-game match against somebody rated 2500. In these games, your rating advantage is 100 points. The sacred Elo table of numbers tells us that your predicted score in that match is 12.8/20. Thus if you actually score +5 (12.5/20), that would be viewed as a slightly sub-par performance, and your rating would decrease by 3 points as a result.
However, the unspoken assumption here is that the special table of numbers is accurate. Today's chess statistician has the advantage of incredible computing power, as well as millions of games' worth of empirical evidence. Neither of these resources were available to Elo at the time his table of numbers was proposed. Thus it is possible, today, to actually check the accuracy of Elo's theory. Here is what happens if you graph the actual data:
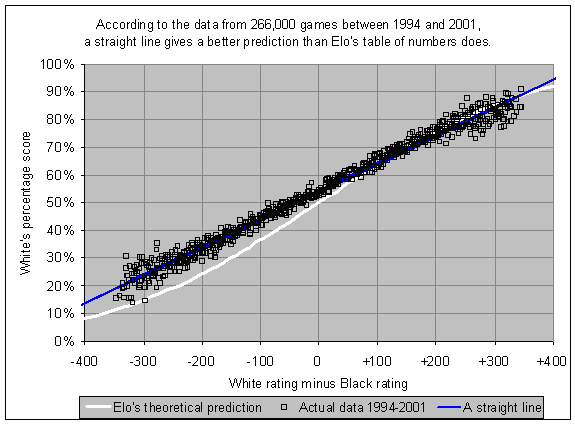
Elo's numbers (represented by the white curve) came from a theoretical calculation. (If you care about the math, Elo's 1978 book tells us that the numbers are based upon the distribution of the difference of two Gaussian variables with identical variances but different means.) This inverse exponential distribution is so complicated that there is no way to provide a simple formula predicting the score from the two players' ratings. All you can do is consult the special table of numbers.
I don't know why it has to be so complicated. Look at the blue line in my graph. A straight line, fitted to the data, is clearly a more accurate depiction of the relationship than Elo's theoretical curve. Outside of the +/- 350 range, there is insufficient data to draw any conclusions, but this range does include well over 99% of all rated games. I have a theory about where Elo's calculations may have gone astray (having to do with the uncertainty of rating estimates), but the relevant point is that there is considerable room for improvement in Elo's formula.
Why do we care so much about this? Well, a player's rating is going to go up or down, based on whether the player is performing better than they "should" be performing. If you tend to face opponents at the same strength as you, you should score about 50%; your rating will go up if you have a plus score, and down if you have a minus score. However, what if you tend to face opponents who are 80-120 points weaker than you? Is a 60% score better or worse than predicted? What about a 65% score? More than half of the world's top-200 actually do have an average rating advantage of 80-120 points, across all of their games, so this is an important question.
Let's zoom into that last graph a little bit (also averaging White and Black games together). The white curve in the next graph shows you your predicted score from the Elo table, if you are the rating favorite by 200 or fewer points. That white curve is plotted against the actual data, based on 266,000 games between 1994 and 2001, using the same colors as the previous graph:
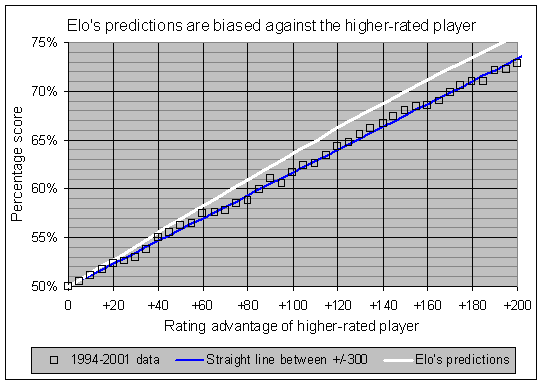
There is a consistent bias in Elo's table of numbers against the higher-rated player. To put it bluntly, if you are the higher-rated player, a normal performance will cause you to lose rating points. You need an above-average performance just to keep your rating level. Conversely, if you are the lower-rated player, a normal performance will cause you to gain rating points.
For instance, in that earlier example where you had a rating of 2600 and scored 12.5/20 against a 2500-rated opponent, you would lose a few rating points. As it turns out, your 12.5/20 score was actually a little BETTER than would be expected from the ratings. Using the blue line in the last graph, you can see that a 100-point rating advantage should lead to a score slightly over 61%, and you actually scored 62.5%. Thus, despite a performance that was slightly above par, you would actually lose rating points, due to the inaccuracy of Elo's table of numbers.
It may seem trivial to quibble over a few rating points, but this is a consistent effect which can have large cumulative impact over time. For instance, it appears that this effect cost Garry Kasparov about 15 rating points over the course of the year 2000, and the same for Alexei Shirov. With their very high ratings, each of those players faced opposition that (on average) was weaker by 80-120 points, and so the ratings of both Kasparov and Shirov were artificially diminished by this effect.
In contrast, Vladimir Kramnik also had a high rating in 2000, but due to his large number of games against Kasparov during that year, Kramnik's average rating advantage (against his opponents) was far smaller than Kasparov's or Shirov's. Thus, this bias only cost Kramnik 1 or 2 rating points over the course of the year 2000.
The bias also has an effect on the overall rating pool. It compresses the ratings into a smaller range, so the top players are underrated and the bottom players are overrated. Players who tend to be the rating favorites in most of their games (such as the top-100 or top-200 players) are having their ratings artificially diminished due to this effect. Thus the rise in grandmaster ratings, that we have seen in recent years, would have been even greater had a more accurate rating system been in place. You will see an illustration of this later on, when we look at some monthy top-ten lists since 1997 using various rating formulas.
It's great to have some sort of scientific justification for your formula, as Professor Elo did, but it seems even more important to have a formula which is free of bias. It shouldn't matter whether you face a lot of stronger, weaker, or similar-strength opponents; your rating should be as accurate an estimate of your strength as possible, and this simply does not happen with Elo's formula. My "linear model" is much simpler to calculate, easier to explain, significantly more accurate, and shows less bias.
For all its flaws, the Elo rating formula is still a very appealing one. Other rating systems require more complicated calculations, or the retention of a large amount of historical game information. However, the Professional ratings are known to be considerably more dynamic than the FIDE ratings, and for this reason most improving players favor the Professional ratings. For instance, several months ago Vladimir Kramnik called the FIDE ratings "conservative and stagnant".
Nevertheless, it is important to realize that there is nothing inherently "dynamic" in Ken Thompson's formula for the Professional ratings. And there is nothing inherently "conservative" in Arpad Elo's formula for the FIDE ratings. In each case there is a numerical constant, used within the calculation, which completely determines how dynamic or conservative the ratings will be.
In the case of the Elo ratings, this numerical constant is the attenuation factor, or "K-Factor". In case you don't know, let me briefly explain what the K-Factor actually does. Every time you play a game, there is a comparison between what your score was predicted to be, and what it actually was. The difference between the two is multiplied by the K-Factor, and that is how much your rating will change. Thus, if you play a tournament and score 8.5 when you were predicted to score 8.0, you have outperformed your rating by 0.5 points. With a K-Factor of 10, your rating would go up by 5 points. With a K-Factor of 32, on the other hand, your rating would go up by 16 points.
In the current FIDE scheme, a player will forever have a K-Factor of 10, once they reach a 2400 rating. With a K-Factor of 5, the FIDE ratings would be far more conservative. With a K-Factor of 40, they would leap around wildly, but the ratings would still be more accurate than the current ratings. The particular choice of 10 is somewhat arbitrary and could easily be doubled or tripled without drastic consequences, other than a more dynamic (and more accurate) FIDE rating system.
As an example of how the K-Factor affects ratings, consider the following graph for Viktor Korchnoi's career between 1980 and 1992. Using the MegaBase CD from Chessbase, I ran some historical rating calculations using various K-Factors, and this graph shows Korchnoi's rating curve for K-Factors of 10, 20, and 32. Note that these ratings will differ from the actual historical FIDE ratings, since MegaBase provides a different game database than that used by the FIDE ratings.
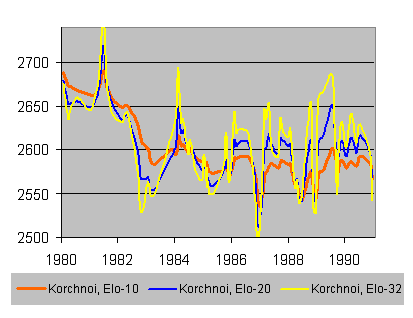
You can see that the red curve (K-Factor of 10) is fairly conservative, slower to drop during 1982-3 when Korchnoi clearly was declining, and remaining relatively constant from 1985 through 1992, almost always within the same 50-point range. For a K-Factor of 20, however, Korchnoi's rating jumps around within a 100-point range over the same 1985-1992 period (see the blue curve), whereas with a K-Factor of 32 there is almost a 200-point swing during those years (see the yellow curve). Thus the K-Factor can easily cause an Elo formula to be either very conservative or very dynamic.
For the Thompson formula, there is also a numerical constant which determines how dynamic the ratings will be. The current Professional ratings use a player's last 100 games, with the more recent games weighted more heavily. If they used the last 200 games instead, the ratings would be sluggish and resistant to change. If they used the last 50 games, they would be even more dynamic. You might think that Professional ratings using only the last 50 games would be far more dynamic than any reasonable Elo-style formula, but in fact the Elo formula with a K-Factor of 32 seems to be even more dynamic than a Thompson formula which uses only the last 50 games. Take a look at the career rating curve for Jan Timman from 1980 to 1992, using those two different formulas. Again, I did these calculations myself, using data from MegaBase 2000.
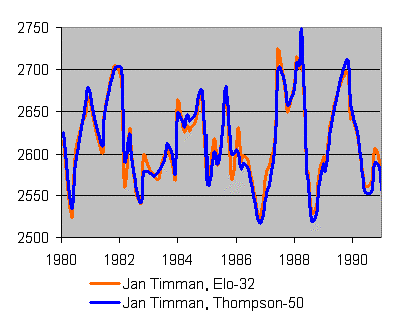
It is clear that the red curve (Elo-32) is even more dynamic than the blue curve (Thompson-50), with higher peaks and lower valleys. However, it should also be clear that the two rating systems are very similar. If you could pick the right numerical constants, the Thompson and Elo formulas would yield extremely similar ratings. In these examples, I chose Korchnoi and Timman more or less at random; my point was to show that there is nothing inherently "dynamic" about the Professional ratings or "conservative" about the FIDE ratings. It is really almost a mathematical accident that they are this way, unless perhaps the initial Thompson formula was specifically intended to be more dynamic than FIDE's ratings.
So, it is clear that the FIDE ratings could be made more dynamic simply by increasing the K-Factor. Is this a good idea?
In an attempt to answer this question, I have run many rating calculations for the time period between 1994 and 2001, using various formulas. In each case, I retroactively determined how accurate the ratings were at predicting future results. Based on those calculations, it became possible to draw a curve showing the relationship between K-Factor and accuracy of the ratings:
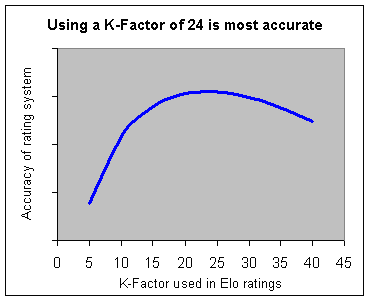
It appears that a K-Factor of 24 is optimal. For smaller values, the ratings are too slow to change, and so ratings are not as useful in predicting how well players will do each month. For larger values, the ratings are too sensitive to recent results. In essence, they "over-react" to a player's last few events, and will often indicate a change in strength when one doesn't really exist. You can see from this graph that even using a super-dynamic K-Factor of 40 would still result in greater accuracy than the current value of 10.
Recent years have seen an increased emphasis on games played at faster time controls. Official FIDE events no longer use the "classical" time controls, and rapid and blitz games are regularly used as tiebreakers, even at the world championship level. There are more rapid events than ever, but rapid and blitz games are completely ignored by the master FIDE rating list. Instead, a separate "rapid" list, based on a small dataset, is maintained and published infrequently and sporadically.
For now, to keep things simple, I want to consider only four classifications of time controls. The "Classical" time control, of course, refers to the traditional time controls of two hours for 40 moves, one hour for 20 moves, and then half an hour for the rest of the game. "Modern" (FIDE) controls are at least 90 minutes per player per game, up to the Classical level. "Blitz" controls are always five-minute games with no increments, and "Rapid" has a maximum of 30 minutes per player per game (or 25 minutes if increments are used). I understand that these four classifications don't include all possible time controls (what about g/60, for instance?). However, please be patient. I will get to those near the end of this article.
The question of whether to rate faster games, and whether to combine them all into a "unified" list, is a very controversial topic. I don't feel particularly qualified to talk about all aspects of this, so as usual I will stick to the statistical side. Let's go through the argument, point-by-point.
(1) I am trying to come up with a "better" rating formula.
(2) By my definition, a rating formula is "better" if it is more accurate at predicting future classical games.
(3) The goal is to develop a rating formula with "optimal" classical predictive power.
(4) Any data which significantly improves the predictive power of the rating should be used.
(5) If ratings that incorporate faster-time-control games are actually "better" at predicting the results of future classical games, then the faster games should be included in the rating formula.
It is clear that Modern, Rapid, and Blitz games all provide useful information about a player's ability to play classical chess. The statistics confirm that conclusion. However, the results of a single Classical game are more significant than the results of a single Modern game. Similarly, the results of a single Modern game are more significant than the results of a single Rapid game, and so on.
If we were to count all games equally, than a 10-game blitz tournament, played one afternoon, would count the same as a 10-game classical tournament, played over the course of two weeks. That doesn't feel right, and additionally it would actually hurt the predictive power of the ratings, since they would be unduly influenced by the blitz results. Thus it appears that the faster games should be given an importance greater than zero, but less than 100%.
This can be accomplished by assigning "coefficients" to the various time controls, with Classical given a coefficient of 100%. For example, let's say you did quite well in a seven-round Classical tournament and as a result you would gain 10 rating points. What if you had managed the exact same results in a seven-round Rapid tournament instead? In that case, if the coefficient for Rapid time controls were 30%, then your rating would only go up by 3 points, rather than 10 points.
How should those coefficients be determined? The question lies somewhat outside of the realm of statistics, but I can at least answer the statistical portion of it. Again, I must return to the question of accuracy and predictive power. If we define a "more accurate" rating system as one which does a better job of predicting future outcomes than a "less accurate" rating system, then it becomes possible to try various coefficients and check out the accuracy of predictions for each set. Data analysis would then provide us with "optimal" coefficients for each time control, leading to the "optimal" rating system.
Before performing the analysis, my theory was that a Modern (FIDE) time control game would provide about 70%-80% as much information as an actual classical game, a rapid game would be about 30%-50%, and a blitz game would be about 5%-20%. The results of the time control analysis would "feel" right if it identified coefficients that fit into those expected ranges. Here were the results:
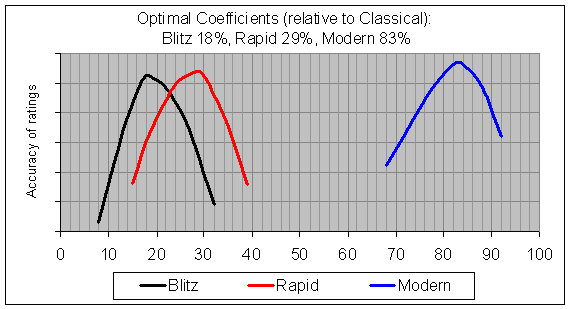
The "optimal" value for each coefficient appears as the peak of each curve. Thus you can see that a coefficient of 83% for Modern is ideal, with other values (higher or lower) leading to less accurate predictions in the ratings. Similarly, the optimal value for Blitz is 18%, and the optimal value for Rapid is 29%. Not quite in the ranges that I had expected, but nevertheless the numbers seem quite reasonable.
To summarize, here are the key features of the Sonas rating formula:
(1) Percentage expectancy comes from a simple linear formula:
White's %-score = 0.541767 + 0.001164 * White rating advantage, treating White's rating advantage as +390 if it is better than +390, or -460 if it is worse than -460.
(2) Attenuation factor (K-Factor) should be 24 rather than 10.
(3) Give Classical games an importance of 100%, whereas Modern games are 83%, Rapid games are 29%, and Blitz games are 18%. Alternatively, use the graph at the end of this article to arrive at an exact coefficient which is specific to the particular time control being used.
(4) Calculate the rating lists at the end of every month.
This formula was specifically optimized to be as accurate as possible, so it should come as no surprise that the Sonas ratings are much better at predicting future classical game outcomes than are the existing FIDE ratings. In fact, in every single month that I looked at, from January 1997 through December 2001, the total error (in predicting players' monthly scores) was higher for the FIDE ratings than for the Sonas ratings:
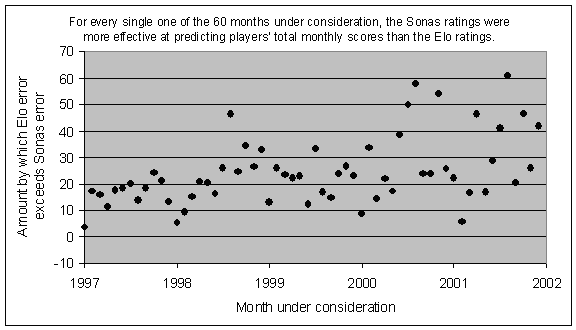
How can I claim that the Sonas ratings are "more accurate" or "more effective at predicting"? I went through each month and used the two sets of ratings to predict the outcome of every game played during that month. Then, at the end of the month, for each player, I added up their predicted score using the Elo ratings, and their predicted score using the Sonas ratings. Each of those rating systems had an "error" for the player during that month, which was the absolute difference between the player's actual total score and the rating system's predicted total score.
For example, in April 2000 Bu Xiangzhi played 18 classical games, with a +7 score for a total of 12.5 points. Based on his rating and his opponents' ratings in those games, the Elo rating system had predicted a score of 10.25, whereas the Sonas rating system had predicted a score of 11.75. In this case, the Elo error would be 2.25, whereas the Sonas error would be 0.75. By adding up all of the errors, for all players during the month, we can see what the total error was for the Sonas ratings, and also for the Elo ratings. Then we can compare them, and see which rating system was more effective in its predictions of games played during that month. In the last graph, you can see that the Sonas ratings turned out to be more effective than the Elo ratings in every single one of the 60 months from January 1997 to December 2001.
You are probably wondering what the top-ten-list would look like, if the Sonas formula were used instead of the Elo formula. Rather than giving you a huge list of numbers, I'll give you a few pictures instead.
First, let's look at the "control group", which is the current Elo system (including only Classical and Modern games). These ratings are based upon a database of 266,000 games covering the period between January 1994 and December 2001. The game database is that provided by Vladimir Perevertkin, rather than the actual FIDE-rated game database, and these ratings are calculated 12 times a year rather than 2 or 4. Thus the ratings shown below are not quite the same as the actual published FIDE ratings, but they do serve as an effective control group.
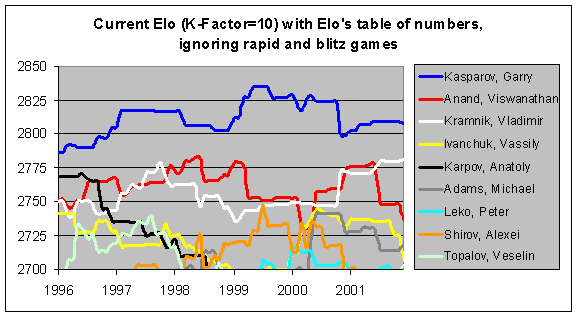
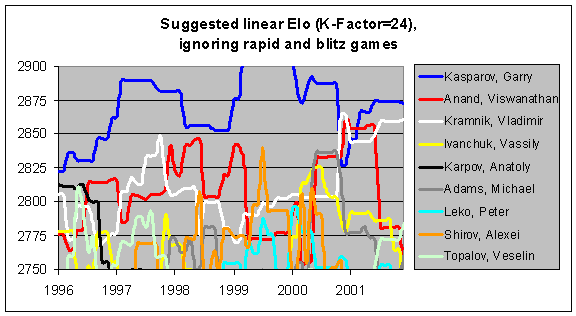
Next, you can see the effect of a higher K-Factor. Using a K-Factor of 24 rather than 10, players' ratings are much more sensitive to their recent results. For instance, you can see Anatoly Karpov's rating (the black line) declining much more steeply in the next graph. Similarly, with the more dynamic system, Garry Kasparov dropped down very close to Viswanathan Anand after Linares 1998. In fact, Kasparov briefly fell to #3 on this list in late 2000, after Kramnik defeated him in London and then Anand won the FIDE championship. And Michael Adams was very close behind at #4.
Finally, by examining the next graph, you can see the slight effect upon the ratings if faster time controls are incorporated. In the years between 1994 and 1997, Kasparov and Anand did even better at rapid chess than at classical chess, and so you can see that their ratings are a little bit higher when rapid games are included. Some other players show some differences, but not significant ones. In general, the two graphs are almost identical.
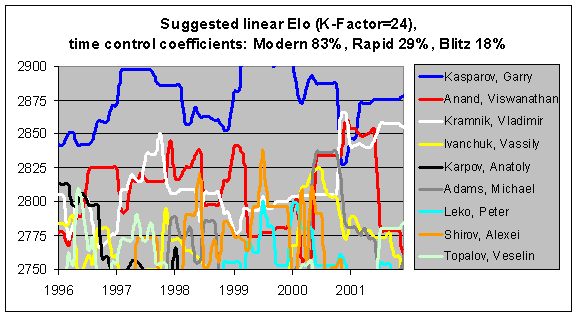
You might also notice that the ratings based upon a linear model with a K-Factor of 24 are about 50 points higher than the ratings with the current formula. As I mentioned previously, this is mostly due to a deflationary effect in the current formula, rather than an inflationary effect in the linear model. Since there is an unintentional bias against higher-rated players in the Elo table of numbers, the top players are having their ratings artificially depressed in the current system. This bias would be removed through the use of my linear model.
It is unsurprising that a rating system with a higher K-Factor would have some inflation, though. If a player does poorly over a number of events and then stops playing, they will have "donated" rating points to the pool of players. Perhaps someone scored 30/80 rather than the predicted 40/80, over a few months. In the current system, they would have donated 100 points to the pool, whereas with a K-Factor of 24, it would have been 240 points instead. Since a very successful player will probably keep playing, while a very unsuccessful player might well stop playing, this will have an inflationary effect on the overall pool. Of course, this is a very simplistic explanation and I know that the question of inflation vs. deflation is a very complicated one.
I am not suggesting that we suddenly recalculate everyone's rating and publish a brand-new rating list. For one thing, it's not fair to retroactively rate games that were "unrated" games at the time they were played. By showing you these graphs, I am merely trying to illustrate how my rating system would behave over time. Hopefully this will illustrate what it would mean to have a K-Factor of 24 rather than 10, and you can also see the impact of faster time controls.
For the sake of continuity of the "official" rating list, it seems reasonable that if this formula were adopted, everyone should retain their previous rating at the cut-over point. Once further games were played, the ratings would begin to change (more rapidly than before) from that starting point.
The above conclusions about time controls were based upon only four different classifications: Blitz, Rapid, Modern, and Classical. However, those classifications do not include all typical time controls. For instance, Modern has a minimum of 90 minutes per player per game, whereas Rapid has a maximum of 30 minutes per player per game. Ideally, it would be possible to incorporate the coefficients for these four classifications into a "master list" which could tell you what the coefficient should be for g/60, or g/15 vs. g/30 for that matter.
I did a little bit of analysis on some recent TWIC archives, and determined that about 50% of games last between 30 and 50 moves, with the average game length being 37 moves. I therefore defined a "typical" game length as 40 moves, and then looked at how much time a player would use in a "typical" game in various time controls, if they used their maximum allowable time to reach move 40.
This means a player would spend 5 minutes on a typical Blitz game, 5-30 minutes on a typical Rapid game, 90-120 minutes on a typical Modern game, and 120 minutes on a typical Classical game. Finally, I graphed my earlier coefficients of 18%, 29%, 83%, and 100% against the typical amount of time used, and arrived at the following important graph:
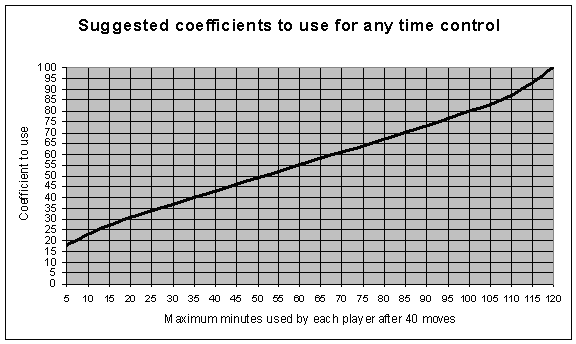
This sort of approach (depending upon the maximum time used through 40 moves) is really useful because it lets you incorporate increments into the formula. A blitz game where you have 5 minutes total, will obviously count as a 5-minute game in the above graph, and you can see that the coefficient would be 18%. A blitz game where you get 5 minutes total, plus 15 seconds per move, would in fact typically be a 15 minute game (5 minutes + 40 moves, at one extra minute per four moves = 15 minutes), and so the recommended coefficient would be 27% instead for that time control.
The very common time control of 60 minutes per player per game, would of course count as a 60-minute game, and you can see that this would be 55%. And the maximum coefficient of 100% would be reached by a classical time control where you get a full 120 minutes for your first 40 moves.
It is more important than ever before for ratings to be accurate. In the past, invitations to Candidate events were based upon a series of qualification events. Now, however, invitations and pairings are often taken directly from the rating list. The field for the recent Dortmund candidates' tournament was selected by averaging everyone's FIDE and Professional ratings into a combined list, and then picking the top players from that list. For the first time, a tournament organizer has acknowledged that the FIDE ratings are not particularly accurate, and that a different formula might work better.
The FIDE ratings are way too conservative, and the time control issue also needs to be addressed thoughtfully. I know that this is an extremely tricky issue, and it would be ridiculous to suggest that it is simply a question of mathematics. If change does come about, it will be motivated by dozens of factors. Nevertheless, I hope that my efforts will prove useful to the debate. I also hope you agree with me that the "Sonas" formula described in this article would be a significant improvement upon the "Elo" formula which has served the chess world so well for decades.
Please send me e-mail at jeff@chessmetrics.com if you have any questions, comments, or suggestions. In addition, please feel free to distribute or reprint text or graphics from this article, as long as you credit the original author (that's me).
Jeff Sonas
