FIDE recognizes a two-stage system for fair-play assurance and cheating detection, called “screening” and “full test.” The regulations actually do not specify that these must be filled by the formulas and software I designed. But they do specify two stages. Here I will try to explain why and what problems this structure tries to solve---from an arbiter’s rather than mathematician’s point of view.
 Your personal chess trainer. Your toughest opponent. Your strongest ally.
FRITZ 20 is more than just a chess engine – it is a training revolution for ambitious players and professionals. Whether you are taking your first steps into the world of serious chess training, or already playing at tournament level, FRITZ 20 will help you train more efficiently, intelligently and individually than ever before.
- How can we tell a legitimate upset win by a lower-rated player apart from cheating?
- How can we gain information to answer an accusation of cheating during a tournament?
- How can we get a picture of the overall state of a tournament?
- How can we best allocate attention by our staff, especially in a large Open?
- How can we know what (if any) further steps are appropriate to take in coordination with FIDE and/or a national federation?
These questions do not have easy answers. Far from mathematics being an instant savior, instead it causes troubles that were already bedeviling scientists in the 1700s. Why does repeating an experiment---or what seems to be the same life experience---often give different results? The surprising fact is that the differences and their frequencies most often fall into the same common pattern called the bell curve.
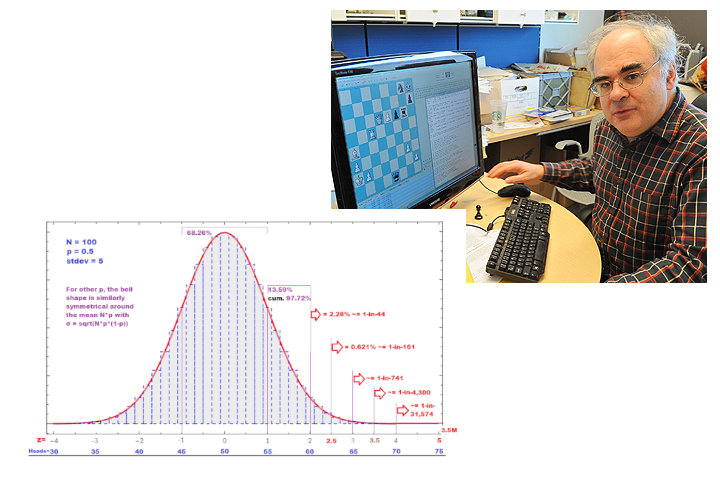
The red line is the bell curve itself. It has a natural abstract scale called “z” that is centered on 0, meaning no deviation from the expected truth. The blue shows possible outcomes of an experiment that seems silly at first: Flip a coin 100 times and count how many “heads” you get. Given that the coin is fair, you expect to get 50 heads---versus 50 tails.
The blue bars show that getting exactly 50 heads is the most likely outcome, but getting 51 heads, or 49 heads, or 52-or-48-or-so, are individually almost as likely. The scales align when getting 55 heads is under z=1 and 45 heads is under -1, which says that plus-or-minus 5 heads is the standard deviation. The picture shows that when you have (at least) N=100 items, the bell curve approximates the coin’s true distribution very well.
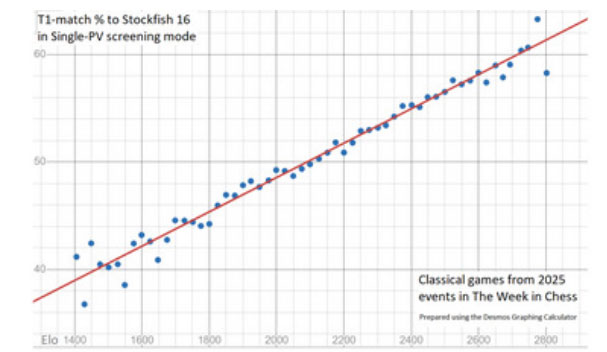
Chess falls right into this pattern. Finding the move that a computer engine considers best is like getting a “heads”. In some positions the best move is obvious, in others hard to find, but over a series of games these cases even out. The following chart shows that if you are rated near 2100, your expected matches to Stockfish 16 (run to a certain depth and node count) over 100 moves are right near 50.
If you have any FIDE rating from 1400 to 2800, your expected frequency goes only from 39% to 61%. If you figure that 20% of positions have a forced or otherwise obvious best move, then the range on the other 80% of more-challenging positions goes from almost 25% to only a hair over 50% for the elite. However this is figured, if we take actual percentages by players in a large tournament---or a bunch of tournaments---and plot them by % over or under their expectation based on rating, we get a bell pattern.
Similar happens for expected versus actual centipawn loss, or for “top 3” moves, or other metrics. The reason is that they are all averages over a series of moves. The Central Limit Theorem states that averages of N independent draws from a numerical distribution---any one distribution---show the bell pattern more and more as N grows.
Exactly what the screening test’s “Raw Outlier Index” (ROI) formula does is “normalize” every player, every rating, every metric onto the same coin-flip scale, with expectation 50 and standard deviation 5. The formula automatically accounts for the lumpiness of the distribution of positions (some having forced moves, other many reasonable choices, and in different stages of games), different characteristics of players---though only in a broad sense trained on 100,000s of games.
This puts every player on the same scale as the bell picture above. Given quick server access for the software, the ROI scores and other vital statistics for each player can be compiled within an hour of games finishing. The reports enable comparing players on the same footing and give instant positive feedback on the tournament’s competitive makeup. Here are some example scenarios:
I. We see a player with ROI score 65. In the diagram this has about a 1-in-750 natural frequency. If it is a huge event like the Olympiad or World Rapid and Blitz, we should not be surprised---we expect to see one or two such scores. The same if it is a youth event with multiple sections. In a small event we should not be alarmed, because there are many more players in comparable tournaments elsewhere the same weekend or week or month… But we can be vigilant and apportion arbiter attention---to spectators as well as players---accordingly.
II. We receive a tournament complaint about the player. If the complaint is based on going over games with engines, then we can first use the ROI to gauge whether there is bias in the complaint. Engines change their preferred move especially in the early stages of their run, and a complainer may regard a move as a “T1-match” if it appears at any time. This is a form of confirmation bias. The screening test avoids this by using a fixed and regular procedure to tally matches and centipawn loss---running the engine long enough to settle down but not too much longer than plausible cheating durations. There also may be selection bias in fixating after-the-fact on a sequence of moves that happens to match the engine often. The ROI score avoids this by using the whole game, by default from turn 9 through turn 60, though there are ways to adjust this range and also isolate games in a series of rounds.
a. If the ROI score is under 60, then by social convention it is in the “completely normal” range within two standard deviations. We might judge to dismiss the complaint, unless there is more specific evidence.
b. If the ROI score is over 60, then we may judge to investigate the complaint further. If there is evidence of a non-engine nature, this may warrant calling for a full test.
III. We see a player score a series of 300+ Elo upset wins. Even without a complaint, there are often whispers. The screening reports show the metrics for each player’s opponents lumped together, and also the move-by-move trace of both sides of every game in a long final section. Often it is possible to judge that the player’s opponents made more than usual mistakes. This is apart from the player’s own ROI score, which may be “completely normal”---or not, leading into the next case.
IV. We see an ROI score above 70. From the bell diagram, this is a one-in-30,000 event. It is still relevant to realize that the number of player data points in FIDE prize-giving events approaches 100,000 in any given year, so such outliers do happen naturally. In 2023 my omnibus screening from Chessbase and issues of The Week in Chess turned up an ROI score of 75 from a 1400s player---who scored only 4.0 from 9. But OK, let’s say the player is among the tournament leaders. Then we can request the full test.
Exactly what the full test does is judge the particular characteristics of the positions a player faced. It compares against pinpoint expectations, rather than against broad averages as in the screening test.
 Smyslov cultivated a clear positional style and even in sharp tactical positions often relied more on his intuition than on concrete calculation of variations. Let our authors introduce you into the world of Vasily Smyslov.
The full test uses a predictive analytic model, which means that it not only projects probabilities for every move in every position by a player of a given rating (and particular skill profile), it also puts confidence intervals on those projections. Put informally, the full test is designed to depth and precision that could enable a bookmaker to set accurate betting lines on chess moves. The analysis needed takes hours per game, however. I will stop short of its technicalities in this article, but besides my published papers with Guy Haworth and Tamal Biswas in 2011—2015, my recent presentation to the 2025 MIT Sloan Sports Analytics Conference (www.youtube.com/watch?v=6w89JIKRcNg) gives some detail and design motivation and examples. The most common outcome is not one of guilt but where the full test discerns that the player faced positions that were more forcing or clear-cut than usual. The model reflects that by giving higher probabilities for matching moves, thus projecting higher optimal move rate (and lower centipawn loss) than the broad averages used in the screening test. This results in a lower score on the z-scale, often landing in the completely normal range when the screening score was above 65.
The point to emphasize here is that only the full test is suitable to render statistical judgments. It states outputs on the z-scale. A main reason the screening test speaks the 100-coinflips scale rather than the z-scale is to remind that it is only the first stage and not for judgment. The screening test shows outliers only in “raw” form. This also reflects a larger separation of concerns. Sometimes onsite evidence may be so clear as to warrant immediate disqualification---with statistical results limited to confirmation and quantifying that-and-how-much “gain of function” occurred. All other cases require more reflection and communication---including with bodies FIDE set up to handle judgments well before the computer era descended.
The system is designed to retard a “rush to judgment”, and I in particular have resisted technology that could enable full-test results to be available more promptly on-site, on-demand. Screening results can be more freely available. The intent since 2014 has been to mount the screening software on a server accessible to any registered arbiter, but the IT commitment needed to maintain such a server has not yet been established by FIDE.
Life might be easier if we could “push a button and get a number” that renders a simple decision. Such a mode would tend to sideline rather than empower the arbiters. But here the main retardant comes not from me or FIDE but from the mathematics itself. The bell curve does not have sharp phases. When we speak of “E-doping”, we may have the image of a physical drug test that would either render a red line for guilt, or not. Never mind that drug tests have their own statistical vicissitudes, there are nothing like “chemical antibodies” to detect in chess games. Between linchpins of a z=2.50 floor for strong statistical impact amid other evidence, to z=5.00 as countenancing judgment by statistics alone, there is a spectrum of unlikelihood (of the “null hypothesis” of fair play) to weigh amid all known factors.
There is one final factor I’ll mention that explains why z-results cannot be taken apart from context. It is completely general in medical practice. Suppose you take a test that is 99.9% accurate for a cancer that affects 1-in-10,000 people, and get a positive. What are the odds that you have the cancer? The impulse is to say “over 99%” but wait. Let’s give the test to 10,000 people, one of whom has the cancer. We can presume that person will give a positive, but based on the accuracy statement, we can expect to get about 10 false positives from the others. Hence all you know is being one of about eleven positives, only one of whom has the cancer. The odds are still about 10-1 against your being “guilty of” the c-word. Thus, knowledge of the Bayesian prior probability of one-in-10,000 is vital.
This is indeed the most commonly spoken estimate of the cheating rate for in-person chess, and it (maybe shaded toward one-in-5,000) is consistent with my experience and broad data.
But now suppose the test is for Covid rather than cancer, with a rate north of 1% even in dormant times. Then the same sample has 100 true positives beside the same 10 false positives, and---we are broadly right to keep you off the airplane. Make the test 30 times more accurate---thus corresponding to the z=4 threshold---and we would have 300-to-1 final judged confidence of “the c-word”. This is the situation in online chess, again shaded toward 2%, i.e., one-in-50. Thus, the playing context is needed to interpret a particular z-score. This also says that although my model is a simple frequentist one, Bayesian reasoning is needed for the interpretation---as well as attention to the number-of-players issue noted above (buzzword: the “Look-Elsewhere Effect”). Knowledge of the mathematics provides guidance and clarity but does not eliminate the mess in life. Fraud detection and medical triage have been wicked problems (https://en.wikipedia.org/wiki/Wicked_problem) ever since Florence Nightengale and Francis Galton developed foundational statistical methods to address the latter, and the ancient wisdom of knowing one’s limitations is just as important as applying the numbers.
Prof. Kenneth Regan | Photo by Douglas Levere