Are the World Champions Just Lucky? Part 2
By Matthew S. Wilson
In Part One of his article the author compared Fischer's crushing 12.5–8.5 victory over Boris Spassky in their 1972 Reykjavik match to the 15.5–14.5 victory of Max Euws over Alexander Alekhine in 1935 – and to the title wins of FIDE knockout champions like Khalifman, Ponomariov, and Kasimdhzhanov. In Part Two Matthew turns his statistical searchlight on Anand vs Carlsen, which will take place in Chennai later this year.
Indirect evidence
After reviewing the conclusions drawn in part ont a natural question arises. Suppose that we rely on such indirect evidence to accept the legitimacy of most world champions. If they really are the best, why are statistically significant match victories so rare?
First of all, the length of the match is very important. Even the “long” 24 game matches of the past are quite short in the eyes of a statistician. And luck can play a major role in small samples. Think of flipping a coin. It is quite possible to get 7 heads out of 10 flips even if there is nothing wrong with the coin. But if you got 7000 heads out of 10,000 flips, then surely the coin is biased – pure luck cannot favor heads so consistently. If you are trying to show that a coin favors heads, you would need 9 or 10 heads in 10 flips. This could be hard to achieve even if the coin really is biased. The threshold for proof is high since when there are so few observations, the outcome can easily be driven by chance rather than by any problem with the coin. But in a larger sample, the percentage of heads can be much lower and still offer convincing evidence, since luck can’t consistently favor one side and will even out over time.
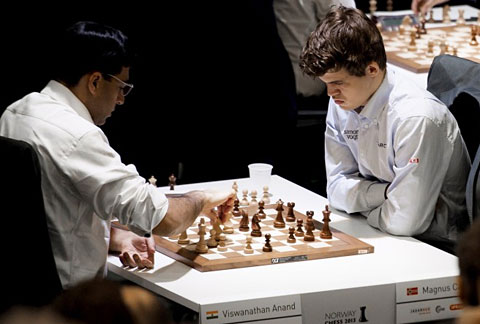
Now what does this tell us about world championship matches? For the 24 game matches with a draw rate of 66%, a player has to win by at least 12.5–7.5 to prove superiority. For the 12 game match that Anand and Carlsen will play in November, the victory has to be at least 7–3 to be statistically significant. Here is the problem: to prove superiority in a short match, a large margin of victory is needed. But the players are often very close in strength, so such a big victory is unlikely to occur.
| Match length |
Smallest statistically significant victory* |
Points per game |
|
24 |
12.5–7.5 |
0.625 |
|
12 |
7.0–3.0 |
0.7 |
|
8 |
4.5–1.5 |
0.75 |
|
6 |
4.0–1.0 |
0.8 |
|
4 |
3.0–0.0 |
1.0 |
|
2 |
2.0–0.0 |
1.0 |
*Assuming a 66% draw rate. Results based on 40,000 match simulations.
To beat Anand 7–3, Carlsen will need a phenomenal performance rating of 2924; for a similar victory Anand will need an even more unlikely performance rating of 3011. But if the match were 24 games instead, then Carlsen would “only” have to perform at approximately 2866, which is quite possible given that he is currently rated 2862.
Thus, short matches make it difficult to achieve a statistically significant victory. But there is another danger that is of interest to more than just statisticians: in shorter matches, there is an increased chance that the weaker player will be crowned World Champion! Think of the most extreme case: a one game match. In Swiss system tournaments, the result of a round is determined by a single game. And it is not too unusual to see a 2000 player defeat a GM in large open tournaments. Of course this doesn’t prove that the 2000 player is better than the GM; unless something is spectacularly wrong with our rating system, the GM is the stronger player. Upsets are very much a possibility in one game matches, though the 2000 player would not stand a chance in a 24 game match. In general, short matches allow weaker players a decent chance of winning. This is how the FIDE knockout tournaments produced champions such as Kasimdhzhanov and how the 2011 Candidates cycle selected Gelfand as the challenger. Upsets were frequent in the two game knockout matches. For example, in this year’s World Cup, Gata Kamsky (2741) was held to a 1–1 draw by IM Yiping Lou (2484) and Judit Polgar was eliminated in round one.
The 2011 Candidates Matches consisted of four game and six game matches, and sent Gelfand to play against Anand. Gelfand is certainly among the world’s top chess players, but few would argue that he was the strongest opponent for the champion. None of Gelfand’s triumphs in the three matches were statistically significant, and he surely benefited from having Aronian and Kramnik knocked out before the final.
A Solution
Longer matches are certainly better for ensuring that the winner is the better player, but there are also some real world factors to consider when setting the length of the match. As an applied statistician, I would love to see Anand and Carlsen play a 100 game or even a 200 game match. But of course it would be difficult to find sponsors for such a mental marathon. So we need a match that is long enough for the better player to prevail, but short enough to be practical. I propose “The 50 Point Principle”: if one player’s strength is 50 rating points above his opponent’s, then the match has to be designed so that the better player wins 90% of the time. The world’s best players are very nearly equal. For example, there are currently 33 players rated between 2700 and 2750. But expecting the world champion to be 50 points stronger than his opponent seems reasonable; at the moment Carlsen is 49 points above Aronian, who is #2 on the rating list. The shortest way to satisfy the 50 point principle is a 26 game match with a two game tiebreaker if the match is drawn 13–13. Fortunately, the traditional 24 game matches were very close to respecting the 50 point principle. If the players are 50 points apart in strength, then the better player wins 85.1% of these matches, loses 7.9%, and draws 7%. So to answer the question asked in the beginning, most of the world champions are not just lucky, since the better player will prevail in a large majority of the standard 24 game matches.
Anand–Carlsen 2013
A 12 game match is far shorter than my recommended 26 games, so should we be worried that the weaker player might win by chance? Normally this would be a concern, but here there is one factor working in our favor: a relatively wide gap in the ratings. On the September rating list, Carlsen is rated 2862 and Anand is at 2775. According to the ratings formula, Carlsen is expected to score 0.62 points per game on average in the match. Since Anand is so much lower rated than Carlsen, it is unlikely that he can score an upset even in such a brief match.
So what will happen? Let’s run some simulations of the match. In their classical games, 20 out of 29 were drawn, so the 66% draw rate is still a reasonable assumption. Of the remaining nine games, Anand actually has the edge: six wins, three losses. However, several of his victories occurred before Carlsen reached his full strength; Carlsen won both of the last two decisive games. The ratings system forecasts that Carlsen will average 0.62 points per game. If we combine this with the 66% draw rate assumption, then in each game Carlsen has a 29% chance of winning and 5% chance of losing. Here are the results from running 40,000 simulations of the match:
| Probability that Carlsen wins |
90.6% |
| Probability that Carlsen wins by a statistically significant margin (7-3 or better) |
26.0% |
| Probability that Anand wins |
3.0% |
| Probability of a drawn match |
6.4% |
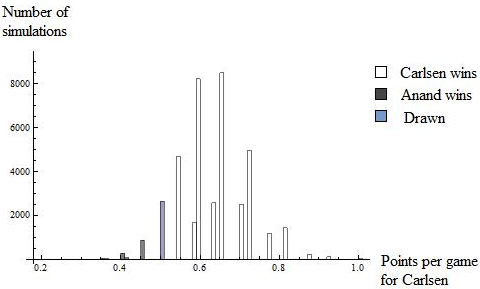
But before we conclude that Anand is doomed, there are a few caveats. Drawn matches are resolved by four rapid tiebreak games, and Anand is well known to be an excellent rapid player. More importantly, these simulations put complete confidence in the Elo rating system, though other statisticians have devised more accurate ways to calculate ratings. It would be interesting to hear their thoughts on the upcoming match. Thirdly, it seems difficult to accept that Anand has just a 5% chance of winning in each game, even though this is the only possible result if we assume that the draw rate is 66% and that the players perform as predicted by the rating system. With these assumptions, Anand has less than a 50% chance of winning a single game in the match!
Also, one observer pointed out that the draw rate of 66% probably isn’t valid for matches in which the rating gap is large. Since Anand and Carlsen were not always so far apart, their draw rate in their previous games might not be a good indicator of how often they will draw in the world championship. To get a better estimate of the draw rate and Anand’s winning chances, I searched my database looking for games that met these requirements:
- Both players 2700+
- Rating gap of 75 – 100 Elo
- Not a rapid or blitz game
In these games, the higher rated player wins 30.7% of the time, draws 60.7%, and loses 8.6%. Based on these results, Carlsen’s expected score would be 0.61 points per game, which is very similar to what his rating would forecast. However, the draw rate has declined and Anand’s winning chances have increased. Using these assumptions, I ran 40,000 simulations:
| Probability that Carlsen wins |
85.7% |
| Probability that Carlsen wins by a statistically significant margin (7-3 or better) |
24.8% |
| Probability that Anand wins |
6.1% |
| Probability of a drawn match |
8.3% |

Anand’s chances have certainly improved, but he is still very much the underdog unless there is something badly wrong with the rating system. However, both players’ ratings have been very stable lately. Anand has been between 2770 and 2790 for more than a year, and Carlsen has seen even less volatility since January 2013 (min. rating: 2861, max rating 2872). So assuming that the ratings are accurate is not unreasonable.
However, in their previous games Anand has a tendency to slightly outperform his rating when he is playing Carlsen. After comparing his average rating to his performance rating, it appears that Anand gains 33 points in strength when Carlsen is on the other side of the chessboard. This pattern is present in both their early games (pre-2010) and recent games (2010-2013). But it is not statistically significant, so it could be just luck. Nevertheless, there remains a possibility that the pattern is real, so how would it affect the forecast? I subtracted 33 points from the rating gap to form an adjusted rating gap. Now that the gap is not so large, it makes sense to return to the 66% draw rate. I plugged these assumptions into the silicon oracle:
| Probability that Carlsen wins |
77.2% |
| Probability that Carlsen wins by a statistically significant margin (7-3 or better) |
14.6% |
| Probability that Anand wins |
10.3% |
| Probability of a drawn match |
12.5% |

The brevity of the match mitigates Anand’s disadvantage: in a 24 game match with a 66% draw rate, he loses in 98% of the match simulations and wins only 0.7% of the matches. But in a twelve game match, maybe he’ll just get lucky.
About the author
 |
Matthew Wilson is a PhD student studying Economics. He graduated from the University of Washington in 2010 with a B.S. in Economics and a B.A. in Math, and then earned an M.S. in Economics from the University of Oregon. He works as a teaching assistant at the University of Oregon, where he has taught applied statistics (econometrics) and economic theory. Currently his research focuses on macroeconomic theory and rational choice.
In chess, he used to be a promising junior, tying for first place in the Washington State Elementary Championships (grades 4-6). He frequently appeared in Washington's top ten and the USCF's top 100 for his age group. But now there is not as much time to study chess, and his rating peaked at 1952. |


