

ChessBase 17 - Mega package - Edition 2024
It is the program of choice for anyone who loves the game and wants to know more about it. Start your personal success story with ChessBase and enjoy the game even more.
Compared to Deep Mind's AlphaZero, the human learning curve for chess skill is much shallower and develops over many years. But what does it actually look like? Does skill typically improve at a constant rate? Are there lengthy plateaus with no improvement, perhaps eventually overcome by study, coaching and playing in stronger tournaments? Is a player’s skill trajectory and maximum performance level readily predictable from early on? Is the learning curve shape the same for very talented and less talented players? Are “J-curves” common, whereby performance declines soon after rating list entry but then improves greatly?
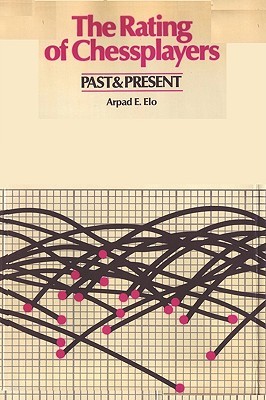 Ratings profiles over time are interesting but are insufficient to answer these questions well. In his book “The rating of chess players past and present”, Arpad Elo presented rating trajectories over age of some famous players. He mostly found curves that initially increased, peaked around age 35 and then declined, as the mental slow-down and decreased ability to cope with novelty that comes with ageing setting in. However, chess learning curves best are examined over number of rated games instead of time and with players taken to their maximum performance limit, and only up until the typical peak age of 35. Playing rated games seems to be the major determinant of skill level and curves over time and games can differ greatly. A player might play few or no games over a few years but many in another span. A lengthy plateau over time may mean few games being played instead of no improvement, as it would over number of games.
Researchers in psychology and economics have extensively studied learning curves for many different skills. In general, skill development tends to follow a similar pattern, regardless of the skill’s complexity and the timescale. Improvement, usually measured by time to perform the task and/or by performance accuracy, typically is rapid at first and then its rate progressively declines until a maximum performance level is approached. Most improvement thus occurs early on. Lengthy plateaus followed by rises can occur, perhaps when the learner discovers a new way to do the given task, but are not that common. For very complex skills such as solving differential equations, carrying out scientific research or piloting a modern jet fighter, learning curves may be flat for many persons because the task is just too difficult.
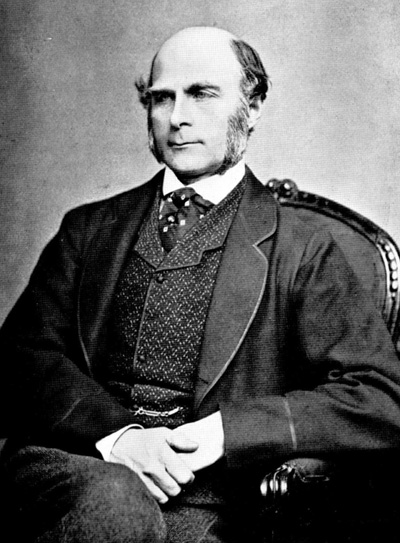 In the 19th Century, polymath Francis Galton [left] proposed that natural talent for a given skill determines the rate of gain and the asymptotic performance level. He likened skill development to gains after beginning a weight-lifting program. Initially, muscle strength can rise rapidly with exercise but gains begin to level off and eventually cease. The more genetically talented improve faster and reach higher maximum strength levels.
When a skill asymptote is reached after extensive practice, performance can become automatic, performed without conscious awareness. For instance, a skilled touch typist can operate on automatic pilot. Ask where the letter p is on the keyboard and he or she may go through the motions of typing the p key, and watching where the fingers go.
Chess playing at a high level is a “hyper-complex skill”, without a real automation phase, like such skills as running a large corporation in a changing economy or commanding an army in battle. Continual monitoring of changing conditions, adaptation to change, creativity, calculation of future possibilities, and other factors are needed to avoid “Kodak moments” where automatic responses fail.
Certainly, some component skills of chess playing can become automatic, such as recognizing a smothered mate pattern or playing a simple king and pawn ending with an outside passed pawn. Indeed, some players conduct blitz games in automatic mode, using only “chess intuition”; not calculating, planning or speculating on what the opponent is up to. But in slow games against strong opponents, much conscious thought is needed, even for highly practised players.
Interestingly, research shows that the typical learning curve for many skills often can be described reasonably well by an equation called a power function, expanded on below. This function even has a name; the “power law of practice”. With a simple skill such as making cigars from paper and tobacco, performance time typically drops rapidly at first and then begins to level off according to the power law, slowly approaching the physical limit of how quickly the task can be performed. The power law can well describe the development of complex skills such as using a new surgical technique. Surgery performance time progressively decreases with number of initial operations according to the power law, and perhaps alarmingly, patients suffer progressively fewer complications in the surgeon’s later operations.
The power law is used in industry for making predictions about how much further training is needed until an acceptable performance level is reached. How many operations does a surgeon need before complications are unlikely? Which of several fighter pilot candidates is likely to reach the higher performance level and after how much practice? A factory manager may use the power law for costing. Say a new production process is used to produce X units of a new product. Some workers will learn their new task faster and the actions of all need to be coordinated. Overall factory time to produce successive units can be predicted to some degree with the power law.
A few years ago, I did a study of chess skill development with 387 FIDE-rated players. Most were grandmasters. They entered the FIDE rating list at age 14 or less in July 1985 or later, when FIDE first reports game numbers and had played at least 750 FIDE-rated games. I determined ratings in categories of approximately 50 games and fitted various equations to their pattern of development. On average, they tended to reach near asymptote after about 750 rated games. Some players improved very little from list entry. Some improved a great deal and their development pattern was well described by the power law. Less talented players tended to peak earlier than 750 games and then started to show a performance decline, perhaps because various life events intervened or they realized the limits of their natural talent.
But the study had some drawbacks. One problem is that players usually learn the moves years before getting an official rating, and it is difficult to count all unrated or nationally rated games. Perhaps some players improved little because they had been playing for many years already in nationally rated tournaments and had already reached their talent limit by list entry.
To get around these problems, recently I did another study. I used FIDE rating data of all individuals who entered the list from July 1985 at age nine or less (instead of age 14) and who had played at least 1000 FIDE-rated games by July 2016 and who gained at least 300 rating points since list entry. The 300 point requirement gives much performance upside to see curve shapes, eliminating players who improved little. There were 23 such players. They would have been playing a few years before FIDE list entry and some entered the rating list at a high level. Nevertheless, it is interesting to see the learning curves from near their career starts.
Figure 1 (below) shows the mean curve of all 23 players to 1049 games, with ratings in approximate 50 game categories, and with 21 data points in all. The large dots are the actual average ratings and the line shows the fit of the power law. The curve starts at 49 games rather than zero. The fit is almost perfect, as most points are very close to the theoretical curve generated from the power law equation. Most improvement happens early on and then performance starts to level off toward a near asymptote after around 1000 games. No individual showed a J-curve.
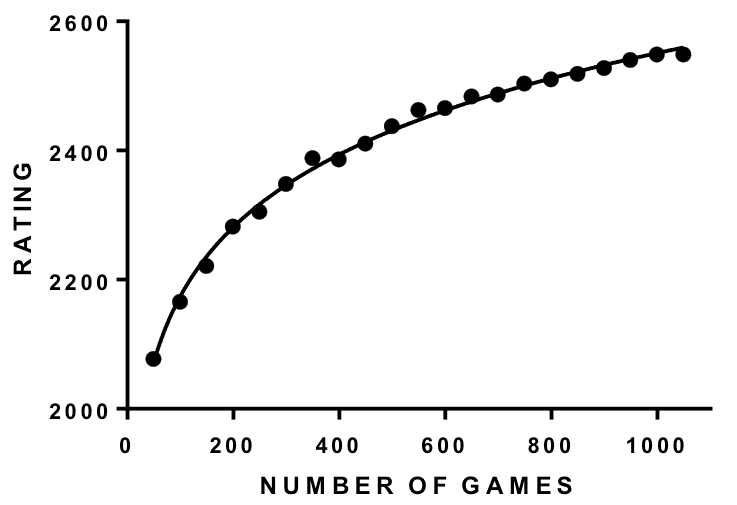
Figure 1
The power law can predict where the curve will go from relatively early in practice. Figure 2 shows the Figure 1 power law curve (derived from data up to 1049 games, using 21 data points) and a second curve based on just four data points; from ratings only at 49, 99, 149 and 199 games. In other words, taking the average ratings at only up to 199 games, I fitted a power function to these four data points and used the equation to project the curve out to 1049 games. The two curves are very close, with only a slight under-prediction by the projection from 199 games. The predicted rating at 1049 games from the curve based on four data points to 199 games is about 2536, quite close to the actual value of about 2549. So, the power law gives a reasonable idea of where the ratings will go from just 199 games.
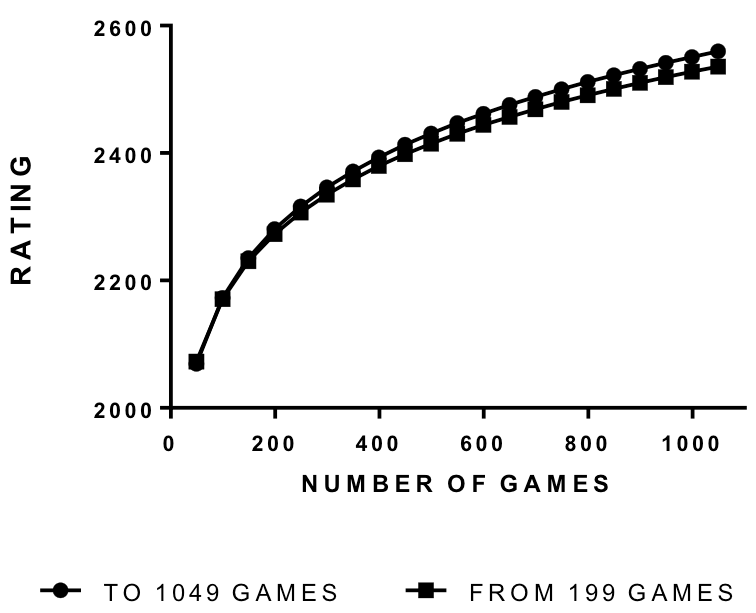
Figure 2
Individual learning curves can be more ragged than this average curve but the power function still can fit well. Figures 3 and 4 give data of the two highest rated players of the 23. They learned the moves at age 4 and 5 and played a few years before entering the FIDE rating list. Both learning curves are good fits to the simple power function and it gives a good idea of where the curves will go from 199 games.
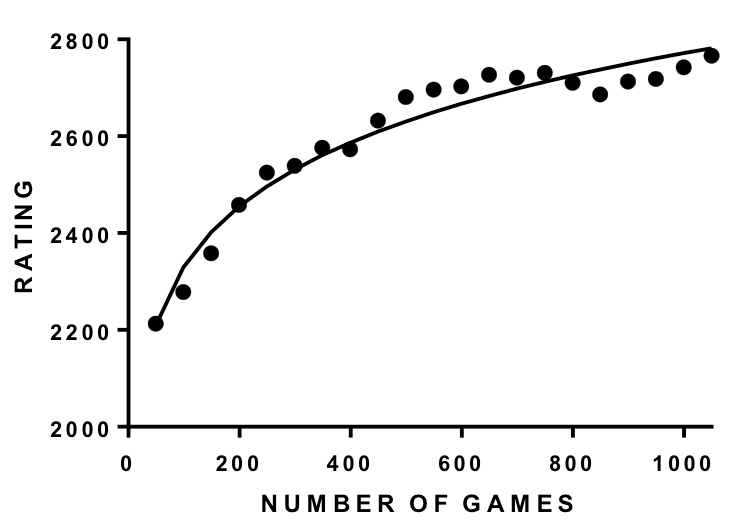
Figure 3
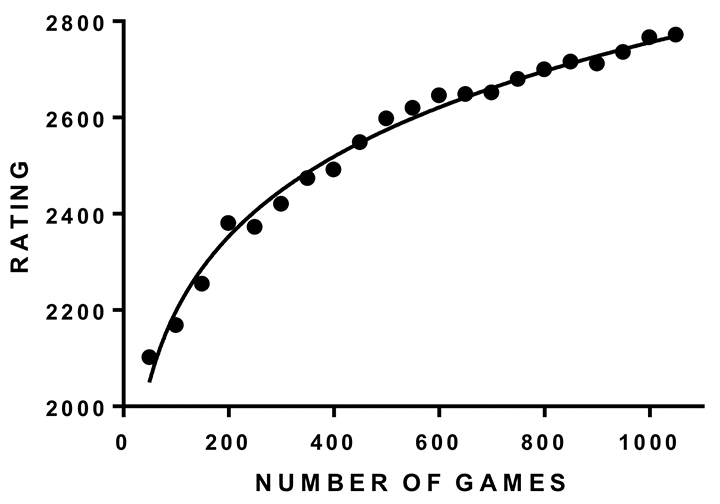
Figure 4
Figures 5 and 6 show that the curves for each from Figures 3 and 4 and the predicted curve from 199 games. In both cases the curve from 199 games slightly under-predicts ratings at 1049 games, but not by much.
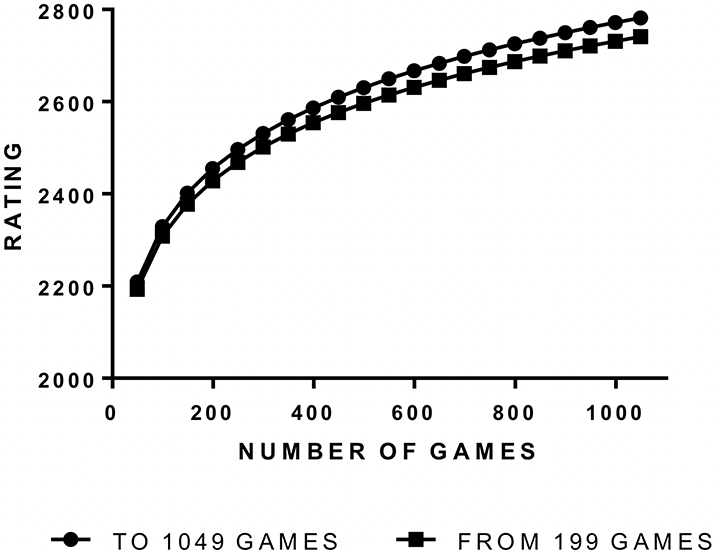
Figure 5
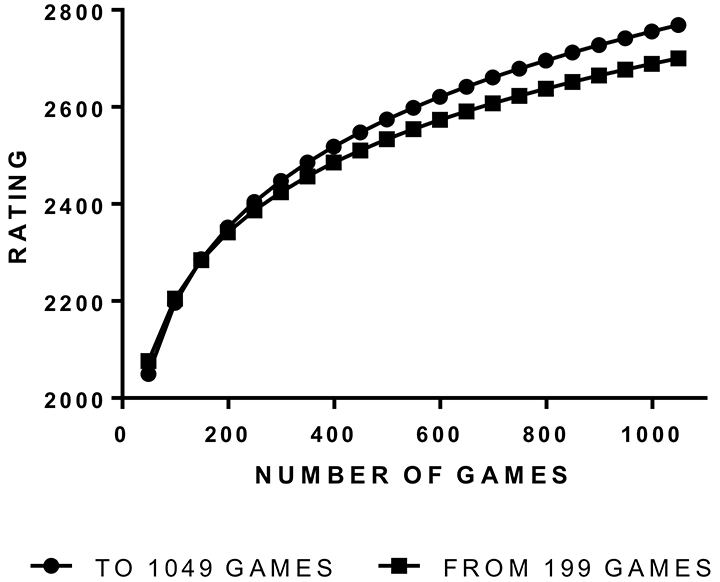
Figure 6
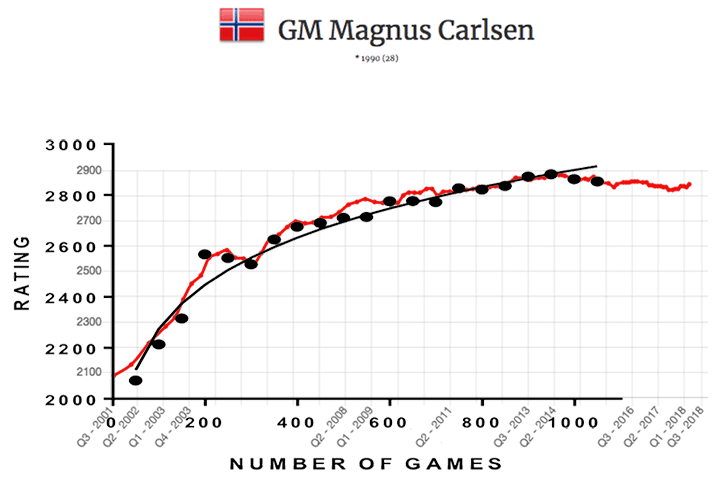
Figure 7 gives another example; the FIDE rating learning curve for Magnus Carlsen, up to July 2016. He learned the moves at age five years, took the game up seriously at age eight and entered the FIDE rating list in 2001 at age 10.
For the first 199 games, the learning curve is very steep indeed, verging on the vertical. But the rate levels off and peaks around 1000 games. His very impressive top rating of 2882 still is the record. The simple power function fits all the data well. However, the prediction of the equation based on data up to 199 games is not so good, so here the power law does not work so well. It predicts a rating of 3023 at 749 games versus the actual value of 2826 and of 3174 at 1049 games instead of the actual 2853.
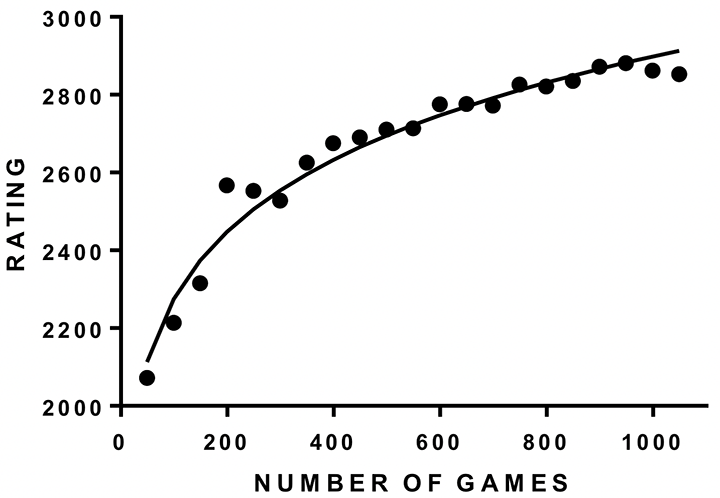
Figure 7
Using mathematics to describe and predict complex and variable human behaviour can be dicey but is useful with skill learning, within limits. The power law works best with averages over many individual curves but can help describe and predict chess learning curves for some individuals when data are available from early in their careers.
Researchers have applied many different equations to learning curves. The power law has several complex versions with added parameters for the amount of previous experience and maximum performance level, but these do not work well with FIDE data. The simple version used here is
Y = a* Xb
where Y is rating, X is number of games, and a and b are fitted parameters. A is the curve starting point and b is the rate of change. If b is negative, the curve goes downwards, and if it is positive, the curve goes upwards. For example, the equation for the mean data of 23 players up to 1049 games is as follows; rating = 1580 times number of games raised to the power of 0.069.
Microsoft Excel will fit the power function to data. Input the cumulative games count in one column and the ratings at each count in another, click “insert a line diagram” and then click “fit trend line” and “fit power function” (depending on the Excel version). The equation with fitted parameters is displayed on the diagram and can predict future performance by plugging in different game values.
I have only tested the power law with data up to at least 199 games and with FIDE ratings from players who enter the domain quite young. How well it works with rated games from a national federation is uncertain but is worth a try. As noted, the power law works best with grouped data of many individuals so predictions from a few games for any one person should not be taken unduly seriously.
Elo, A. E. (1978). The rating of chess players, past and present. New York: Arco. (2008 edition, New York: Ishi Press.)
Gaschler, R., Progscha, J., Smallbone, K., Ram, N., & Bilalic, M. (2014). Playing off the curve- testing quantitative predictions of skill acquisition theories in development of chess performance. Frontiers in Psychology, 5, 923.
Howard, R. W. (2014). Learning curves in highly skilled chess players: A test of the generality of the power law of practice. Acta Psychologica, 151, 16-23.
Howard, R. W. (in press). Development of chess skill from domain entry to near asymptote. American Journal of Psychology.
Papachristofiet, O., Jenkins, D. & Sharples, L. D. (2016). Assessment of learning curves in complex surgical interventions; a consecutive case-series study. Trials, 17, 266.