By Jeff Sonas
In recent years I have participated in several FIDE meetings of "ratings experts" in order to discuss various things about the FIDE rating system. One of the great benefits of this participation was that FIDE sent me all of their historical datasets with game results and tournament results. I don't think very many people have access to all this data, especially because there was a lot of processing needed in order to make it useful for analysis, and so I thought I should share some interesting findings. This will be the first in a series of articles about FIDE ratings.
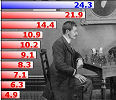
First let's briefly cover some of the basics. Most of you probably know that the Elo system involves calculating the rating difference between the two players in a game, and then looking up that number in the Elo Expectancy Table (available on the FIDE website) in order to determine each player's "expected score" in the game. Then for each player, you compare their actual score in the game, against their expected score, and multiply that difference by their K-factor (which is either 10, 15, or 25). The result tells you how much their rating will change (as a result of the game) the next time ratings are recalculated, which happens every two months. If you did better than expected, your rating will increase, and if you did worse than expected, your rating will decrease. This is what the Expectancy Table looks like, graphically:
So for instance if you are rated 200 points higher than your opponent, you can read from the graph (or the FIDE website) that you should score 76%. You can see the characteristic logistic "S-curve" that flattens out near 100% or 0%, showing that even with a 500-point or 600-point Elo advantage, you are still not guaranteed to win all the time; if you played ten or twenty games you would probably be expected to give up at least one draw. However, the above curve is not quite how the system actually works for extreme differences in rating. There is a special rule known as the "400-point rule", saying that any rating differences greater than 400 points will be treated as exactly 400 points, for the purpose of rating calculations. So the curve really should be drawn like this:
You can see that within the range of +/- 400 points, it is still slightly curved, but it levels off so that you can never have a predicted score of more than 92%, or less than 8%. This special rule used to be the "350-point rule", but the cutoff level was changed a couple of years ago from 350 to 400. So if you play 100 games against someone rated a thousand points lower than you, the Elo system will still assume you should score 92/100, even though your real score will almost certainly be far better than 92%. And therefore you ought to gain a bunch of rating points from this exercise.
So that is the theory, telling us what the %-score should theoretically be for various rating differences. What is happening in actual practice? Thanks to the game-by-game data provided by FIDE, we can now graph that as well. We always could have done this from ChessBase or TWIC data in the past, but not for the whole set of FIDE-rated games across the whole rating pool. The comprehensive game-by-game results have only been available to FIDE within the past few years, as it used to be that tournament directors only submitted overall totals for each participant, rather than the result of each individual game. But thanks to rules changes in 2006 and 2008, FIDE has been collecting full game-by-game outcomes for a few years, and we can start to look at the results. All of the following analysis is based upon a dataset of 1.54 million FIDE-rated games played between October 2007 and August 2010, and it represents virtually the entire set of games used by FIDE for calculating ratings during that period.
As you see, the real results do indeed seem to follow the overall same curved shape – a nearly straight line when the players are closely matched, and then flattening out near the 100% or 0% score. But although the overall shape is the same, how closely do the theoretical percentages (the white lines from the previous graph) really match the actual results (the black dots in this graph)? Well, when you plot them together, this is what you see:
I want to call attention to two main things here. You can see that in the middle region of the graph (for instance within the red box), the white line is steeper than the black trend. This means that rating favorites are not scoring as well as their ratings say they should. Also, look out at the edges, for instance within the blue box. You can see that due to the "400-point rule", the expected score (for the heavy rating favorites) levels off at 92%, but in reality the heavy favorites are scoring much higher than 92%. Let's "zoom" in to that region (surrounded by the blue box) and look at the data a little closer:
By the way, in this graph (and in the previous ones), there is one black dot for each possible integer rating difference. For instance, out of all the games (there were 836 of them) where the rating difference was exactly 400 points, the higher-rated players scored 88.2%, and so you will see one black dot for a "Difference in ratings" of 400 and a "% Score" of 88.2%. And out of all the games (there were 789 of them) where the rating difference was exactly 401 points, the higher-rated players scored 87.4%, and so you will see one dot at the corresponding location in the graph. So although there are only 376 dots shown in the above graph, it actually represents more than 166,000 games.
It would be reasonable to think that chess is "chaotic" enough that there is some maximum expected percentage (lower than 100%) that you can't exceed, no matter what the rating difference. But it is clear from the above data that if there is such a maximum level, it is way higher than 92%. You can see a clear trend that is not leveling off anywhere below a 98% score. It's a little hard to tell whether the data is in fact leveling off at all, because there are only a few games played at each integer rating difference. For there were only 60 games played with a rating difference of exactly 682, with the stronger player scoring 96.7%, and only 53 games played with a rating difference of exactly 700 (the stronger player scored 98.1%), and so on. In order to really visualize the trend, we have to group the results together so we have fewer dots, but ones representing larger ranges of rating differences. It would also be good to look at rating differences higher than 700. This leads to the following, where each dot represents a span of 10 Elo points (in the rating difference) rather than just one:
So this tells me that when you have a rating advantage of 700, 800, or even 900 points, you are typically scoring up there in the 98% to 100% level, despite the fact that you are only expected to score 92% according to the Elo formula being used. So you have a quite realistic expectation of gaining 5-10 points in your rating for every 10 games you play against this type of opponent. I really don't see any good reason for the 400-point rule anymore, and it clearly can be exploited. I do see some evidence up at the top there, that perhaps once you hit an 800-point advantage, it is unreasonable to expect a score higher than 99%. So if we do need a rule like this, it ought to be more like an 800-point rule rather than a 400-point rule…
Let's go back to the overall graph (the one with the red and blue boxes), and this time I want to zoom into the red region instead. Here is a zoomed version of the rating difference range from +100 through +300:
No matter where you look on the overall graph, it seems clear that the black curve is a little too "shallow", or you could say the white curve is a little too "steep". In other words, the rating favorites are not scoring as high as they need in order to meet expectation and maintain their rating without loss.
Another way to think of this is that all players' ratings have been stretched a bit too far away from the average. So somebody who has a rating that is 600 points higher than the average player, is actually more like 500 points stronger in terms of true strength. And this ratio of 6:5 is actually very consistent throughout the whole set of data; so you could equally say that someone who has a rating that is 60 points higher than the average player, is actually more like 50 points stronger. And in general, for any two players having a rating difference of X, their true difference in strength is probably more like 0.83X.
Looking at the above graph, for instance, you can see that in the games (there were 3,180 of them) where the stronger player has a 240-point rating advantage, the Elo formula tells us they should be scoring 80%. Instead they are scoring more like 76%, which means they are really only 200 points stronger than their opponents (in terms of the Elo table). And it's the same thing in other places on the graph, with that 6:5 ratio. When the stronger player has an 180-point rating advantage, they should be scoring 73% in those games (there were 4,642 of them) but instead are scoring more like 70%, meaning they are really only 150 points stronger than their opponents (in terms of the Elo table).
So there are two very clear features of this data; they show no mathematical value to having a "400-point rule", and they show that stronger-rated players are not scoring as high as their rating advantage says they should (from the Elo table). However, it does seem clear that the shape of the Elo curve is still good; the ratings are just a bit too stretched from the middle. So what happens if we were to discard the 400-point rule, and to apply a 5/6 scaling factor to all the rating differences, so for instance that if someone has a rating advantage of 60 points, we only "expect" them to be 50 points stronger. Does the data match the predictions then?
Wow! In fact, it does match, very nicely! You can see, therefore, that the "logistic" Elo curve does seem to be an appropriate way to model the relationship between rating difference and expected score, as long as we apply that 83% "squeeze" factor to compress the effective rating differences a bit, and as long as we discard the 400-point rule.
Now, those of you who have paid close attention to my writings over the years may have noticed a clear contradiction between what I just now said, versus what I said in a relatively well-known analysis of mine from 2002, where I strongly suggested using a straight line (instead of the logistic curve) to model the Elo expectancy. If you do have a linear expectancy, then you really must have something like a "400-point rule" because otherwise the straight line goes on forever, both below 0% and above 100%. Back in 2002 I suggested a 425-point rule so that the expectancy would level off at 99.67% (or 0.33%).
I am certainly nine years older now, and hopefully at least a few months wiser! In any event, I have only recently realized that these conclusions from 2002 were a direct result of my dataset focusing only on the strongest players, rather than including the whole pool of rated players. Even today, with the latest FIDE data, I could limit my analysis in a similar way, and reach similar conclusions. For instance, let's look at what you see if you only consider games from 2007 through 2010 where both players are rated 2200+ (and note that this means discarding more than 80% of the available games):
Again, there is that straight line, and no curve in sight! However I have finally realized that this is too artificial an approach. There is no such thing as a rating pool that only has the strongest players in it. Strong players were not always strong players; they came up through the ranks and almost all of them had a rating lower than 2200 at some point. Many of today's weak players will be strong players in five or ten years. Any simulation of the rating pool that I perform, using historical data, must include the entire pool or I risk running into serious data problems.
In fact I now realize that I made a similar "error" when I designed the first Kaggle competition to determine the rating system that is best at predicting future results. In that contest I limited the data to only 8,000 top players, and I have since realized that this was too artificial an approach. So in the current contest I am including all of the players.
Anyway, it seems likely that I am going off on too much of a tangent with the last few paragraphs, so let me return to my primary focus: FIDE ratings in general. I have a lot more to say about ratings, and the current FIDE implementation of the Elo rating system. In particular there are some very interesting things I have discovered about players at different ages, and different K-factors, and the formula used for calculating players' initial ratings, and even rating inflation! All of those are worth talking about, and I intend to do that in the near future. In Part 2 of this series, I will add players' K-factors to the analytical mix, with some quite startling findings…
Copyright Jeff Sonas / ChessBase
Previous ChessBase articles by Jeff Sonas
|

|
The Deloitte/FIDE Chess Rating Challenge
20.02.2011 – Statician Jeff Sonas and Kaggle, a site specializing in data modeling with regular prediction competitions, have launched a new online contest to develop a more accurate chess rating system. Professional services firm Deloitte provides a $10,000 prize to the winner, and FIDE will also bring a top finisher to Athens, Greece to present their rating system. Report and California pictorial. |
|

|
Can you out-predict Elo? – Competition update
21.09.2010 – Can we devise a more accurate method for measuring chess strength and predicting results than Elo, which has done good service for half a century? Jeff Sonas has given statisticians 65,000 games which they must use to predict the results 7,800 other games. The idea is to find out who can out-perform Elo. In the lead is 28-year-old Portugese biochemist Filipe Maia. Current status. |
|
|
Impressions from FIDE rating conference 2010
10.06.2010 – The FIDE ratings conference, held last week in Athens, Greece, spent quite a bit of time discussing the problem of rating inflation. Two different opinions met head on: one of chess statistician Jeff Sonas, USA, and one represented by Polish GM Bartlomiej Macieja. The subject matter is not easy to understand, but our colleague Michalis Kaloumenos made a serious effort to do so. Food for thought. |
|

|
Rating inflation – its causes and possible cures
27.07.2009 – Thirty years ago there was one player in the world rated over 2700. Fifteen years ago there were six. Today there are thirty-three. What is the cause of this "rating inflation". A general improvement of chess skills? A larger number of players in the rating pool? The way the initial ratings are conducted? In this clearly written article statistician Jeff Sonas addresses these questions. Must read! |
|
|
Rating debate: is 24 the ideal K-factor?
03.05.2009 – FIDE decided to speed up the change in their ratings calculations, then turned more cautious about it. Polish GM Bartlomiej Macieja criticised them for balking, and Jeff Sonas provided compelling statistical reasons for changing the K-factor to 24. Finally John Nunn warned of the disadvantages of changed a well-functioning system. Here are some more interesting expert arguments. |
|

|
FIDE: We support the increase of the K-factor
29.04.2009 – Yesterday we published a letter by GM Bartlomiej Macieja asking the World Chess Federation not to delay the decision to increase the K-factor in their ratings calculation. Today we received a reply to Maceija's passionate appeal from FIDE, outlining the reasons for the actions. In addition interesting letters from our readers, including one from statistician Jeff Sonas. Opinions and explanations. |
|

|
Making sense of the FIDE cycle
10.12.2005 – Why, many of our readers have asked, are eight players who got knocked out in round four of the World Cup in Khanty-Mansiysk still playing in the tournament? What, they want to know, is the point? Has it something to do with the 2007 FIDE world championship cycle? It most certainly does. Jeff Sonas explains in meticulous detail. Please concentrate. |
|

|
The Greatest Chess Player of All Time – Part IV
25.05.2005 – So tell us already, who was the greatest chess performance of all time? After analysing and dissecting many different aspects of this question, Jeff Sonas wraps it up in the final installment of this series, awarding his all-time chess "Oscar" nomination to the overall greatest of all time. |
|
|
The Greatest Chess Player of All Time – Part III
06.05.2005 – What was the greatest chess performance of all time? Jeff Sonas has analysed the duration different players have stayed at the top of the ratings list, at the highest individual rating spikes and best tournament performances. Today he looks at the most impressive over-all tournament performances in history, and comes up with some very impressive statistics. |
|
|
The Greatest Chess Player of All Time – Part I
24.04.2005 – Last month Garry Kasparov retired from professional chess. Was he the greatest, most dominant chess player of all time? That is a question that can be interpreted in many different ways, and most answers will be extremely subjective. Jeff Sonas has conducted extensive historical research and applied ruthlesss statistics to seek a solution to an age-old debate. |
|

|
How (not) to play chess against computers
11.11.2003 – Is there any way that human chess players can withstand the onslaught of increasingly powerful computer opponents? Only by modifying their own playing style, suggests statistician Jeff Sonas, who illustrates a fascinating link between chess aggression and failure against computers. There may still be a chance for humanity. More... |
|

|
Physical Strength and Chess Expertise
07.11.2003 – How can humans hope to hold their ground in their uphill struggle against chess computers? Play shorter matches, stop sacrificing material, and don't fear the Sicilian Defense, says statistician Jeff Sonas, who also questions the high computer ratings on the Swedish SSDF list. Here is his evidence. |
|

|
Are chess computers improving faster than grandmasters?
17.10.2003 – The battle between humans and machines over the chessbaord appears to be dead-even – in spite of giant leaps in computer technology. "Don't forget that human players are improving too," says statistician Jeff Sonas, who doesn't think it is inevitable that computers will surpass humans. Here is his statistical evidence. |
|
|
Man vs Machine – who is winning?
08.10.2003 – Every year computers are becoming stronger at chess, holding their own against the very strongest players. So very soon they will overtake their human counterparts. Right? Not necessarily, says statistician Jeff Sonas, who doesn't believe that computers will inevitably surpass the top humans. In a series of articles Jeff presents empirical evidence to support his claim. |
|

|
Does Kasparov play 2800 Elo against a computer?
26.08.2003 – On August 24 the well-known statistician Jeff Sonas presented an article entitled "How strong are the top chess programs?" In it he looked at the performance of top programs against humans, and attempted to estimate an Elo rating on the basis of these games. One of the programs, Brutus, is the work of another statistician, Dr Chrilly Donninger, who replies to Jeff Sonas. |
|

|
Computers vs computers and humans
24.08.2003 – The SSDF list ranks chess playing programs on the basis of 90,000 games. But these are games the computers played against each other. How does that correlate to playing strength against human beings? Statistician Jeff Sonas uses a number of recent tournaments to evaluate the true strength of the programs. |
|

|
The Sonas Rating Formula – Better than Elo?
22.10.2002 – Every three months, FIDE publishes a list of chess ratings calculated by a formula that Professor Arpad Elo developed decades ago. This formula has served the chess world quite well for a long time. However, statistician Jeff Sonas believes that the time has come to make some significant changes to that formula. He presents his proposal in this milestone article. |
|
|
The best of all possible world championships
14.04.2002 – FIDE have recently concluded a world championship cycle, the Einstein Group is running their own world championship, and Yasser Seirawan has proposed a "fresh start". Now statistician Jeff Sonas has analysed the relative merits of these three (and 13,000 other possible) systems to find out which are the most practical, effective, inclusive and unbiased. There are some suprises in store (the FIDE system is no. 12,671 on the list, Seirawan's proposal is no. 345). More. |