

ChessBase 17 - Mega package - Edition 2024
It is the program of choice for anyone who loves the game and wants to know more about it. Start your personal success story with ChessBase and enjoy the game even more.
Chess is largely an information game, and over the past 50 years, data (games of players) has become increasingly easier to access due to advancements in technology and personal devices. As such, is there a correlation between the number of top-level games and the number of draws over the course of the last 40 years? Is this due to the increasing number of games that are available for research?
As former U-14 world chess champion in chess, I often get asked this question by my friends or casual players. Many people are interested in the statistical aspects of chess, even if they do not play chess. The problem of draws often arises within the competitive chess-playing community, where I have heard a lot of complaints about how draws are too common, which makes viewing high-level games boring. When I play a game of chess, I know that there are three possible results, a white win, draw, or a black win. For a lot of sponsors and players alike (me included), chess is only really interesting if there is a clear winner. Personally, I only want to win. Thus, a common problem that has arisen in chess is that there is a lack of sponsorship because chess is often considered “boring”, when games may last up to six hours. To the common (non-chess player) viewer, this may seem dull. For this reason, some organizers have set up new types of tournaments and introduced faster time controls as an attempt to draw interest. Decisive games in strong tournaments are what catch people’s interests, what draws viewers.
Games that ended in draws can be picked out from the ChessBase database and analyzed. When choosing games to analyse, I selected them based on the strength of the players according to the Elo system. It can be assumed that anyone with an Elo of 2600 and above is very strong. The number of years was chosen based on the first decade (1970) in the 20th century in which a large number of games above an Elo of 2600 are available in Mega Database 2017. By ensuring the games used are of high quality, there can be at least some guarantee that these are the games common players are most interested in viewing. As tournament directors wish to ensure that their tournaments can receive sponsorship and viewership, it is important that the games do not all end in draws.
The "Mega" is the database every serious chessplayer needs. The database contains 7.1 million games from 1500 to 2017, in highest quality standard, full of top level analyses and completely classified.
In the early 20th century, collecting games and storing them became common practice for strong major tournaments. Initially, the only major tournaments that had their games retained were national championships of countries with a strong chess culture at that time (such as Germany, the USSR, Yugoslavia), Interzonals, World Championships and Zonal qualifiers. Thus, there are not many games available for research from the early 1900s.
Nowadays, all tournaments that are affiliated with FIDE (the World Chess Federation) require the recording and inputting of games, which leads to large amounts of information available for research and public consumption. Because there are millions of games in the database, to ease research and to produce results based on only the strongest tournaments (as these attract the most attention), I believed that only games of the world’s top players — where both are above an Elo of 2600 — will be looked at. However, it is important to note that the lack of high-rated games before 1970 can be attributed to the fact that ratings were not in general use yet, and by no means indicates there were not strong games played.
The time frame of the collected games used for this analysis will be from 1971 to August 3rd, 2017. The games are taken from Mega Database 2017, with updated games starting from December 2016 from The Week In Chess. It is important to note that I did not select games of a specific time control — thus after faster time control games became mainstream (think blitz and rapid championships) there may have been more decisive games, thus affecting the draw rates.
To prove my point about how the numbers of recorded games have gone up, the bar chart below shows the total number of games collected per year. Please note that, at the time of writing, 2017 had not yet ended, which explains the low bar in 2017.
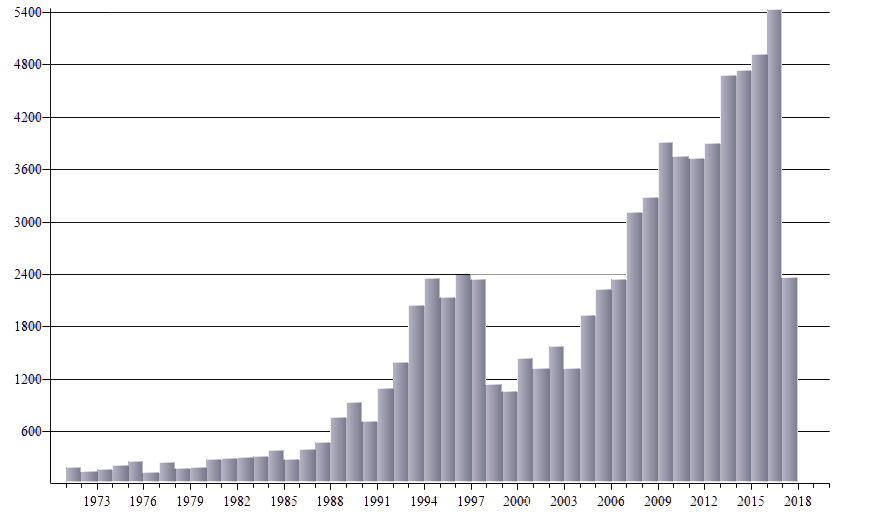
Total number of games per year, from 1970 to the start of August, 2017, by players who both have an Elo above 2600 (click or tap to enlarge)
| Result | Games | Percentage |
| White Win | 22640 | 28.85% |
| Black Win | 14121 | 18.00% |
| Draw | 41697 | 53.14% |
| Total | 78468 | 100% |
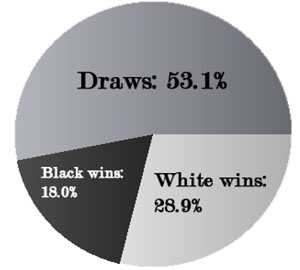
The table above shows an overall summary of all the games used in this analysis. Out of the total number of 78,468 games played by players who both have an Elo above 2600. This is illustrated more clearly in a pie chart of the same data.
As can be seen, the majority of games are drawn. There are various reasons for this. Due to the fact that only top-level games were considered, most of the time, both players are fairly evenly matched, which results in equal play and an eventual draw. Likewise, players at the top level are more likely to play “safe”, meaning they will try to play for a draw from the very start, as they have more to lose. There are also many ways for a draw to occur, such as the three-fold repetition, which, according to Article 5 of the Official FIDE Handbook, means “the game may be drawn if any identical position is about to appear or has appeared on the chessboard at least three times.” Other ways to draw include, “agreement between the two players during the game. This immediately ends the game” as well as the "fifty move rule": “if each player has made at least the last fifty consecutive moves without the movement of any pawn and without any capture.” The number of rules that can cause a draw makes it more likely for the result to happen.
Let’s take a look at the draw rates per year, based on games where both players had an Elo above 2600. Please note that games that did not have inputted ratings have been omitted because a search function by Elo was used.
| Year | Total | Draw |
% |
Year | Total | Draw |
% | |
| 1971 | 180 | 96 | 53.33% | 1995 | 2134 | 1084 | 50.80% | |
| 1972 | 132 | 78 | 59.09% | 1996 | 2380 | 1278 | 53.70% | |
| 1973 | 166 | 106 | 63.86% | 1997 | 2342 | 1270 | 54.23% | |
| 1974 | 204 | 132 | 64.71% | 1998 | 1133 | 601 | 53.05% | |
| 1975 | 252 | 180 | 71.43% | 1999 | 1049 | 561 | 53.48% | |
| 1976 | 128 | 96 | 75.00% | 2000 | 1430 | 819 | 57.27% | |
| 1977 | 238 | 146 | 61.34% | 2001 | 1319 | 746 | 56.56% | |
| 1978 | 172 | 102 | 59.30% | 2002 | 1567 | 812 | 51.82% | |
| 1979 | 186 | 116 | 62.37% | 2003 | 1320 | 737 | 55.83% | |
| 1980 | 274 | 186 | 67.88% | 2004 | 1897 | 984 | 51.87% | |
| 1981 | 286 | 174 | 60.84% | 2005 | 2218 | 1264 | 56.99% | |
| 1982 | 294 | 176 | 59.86% | 2006 | 2335 | 1244 | 53.28% | |
| 1983 | 312 | 208 | 66.67% | 2007 | 3102 | 1630 | 52.55% | |
| 1984 | 382 | 268 | 70.16% | 2008 | 3271 | 1812 | 55.40% | |
| 1985 | 276 | 170 | 61.59% | 2009 | 3901 | 2006 | 51.42% | |
| 1986 | 386 | 212 | 54.92% | 2010 | 3741 | 1997 | 53.38% | |
| 1987 | 466 | 246 | 52.79% | 2011 | 3719 | 2063 | 55.47% | |
| 1988 | 754 | 482 | 63.93% | 2012 | 3893 | 2077 | 53.35% | |
| 1989 | 926 | 538 | 58.10% | 2013 | 4677 | 2392 | 51.14% | |
| 1990 | 706 | 408 | 57.79% | 2014 | 4732 | 2282 | 48.22% | |
| 1991 | 1088 | 558 | 51.29% | 2015 | 4917 | 2480 | 50.44% | |
| 1992 | 1382 | 734 | 53.11% | 2016 | 5429 | 2642 | 48.66% | |
| 1993 | 2036 | 1068 | 52.46% | 2017 | 2363 | 1316 | 55.69% | |
| 1994 | 2350 | 1120 | 47.66% |
Table of drawing percentage per year
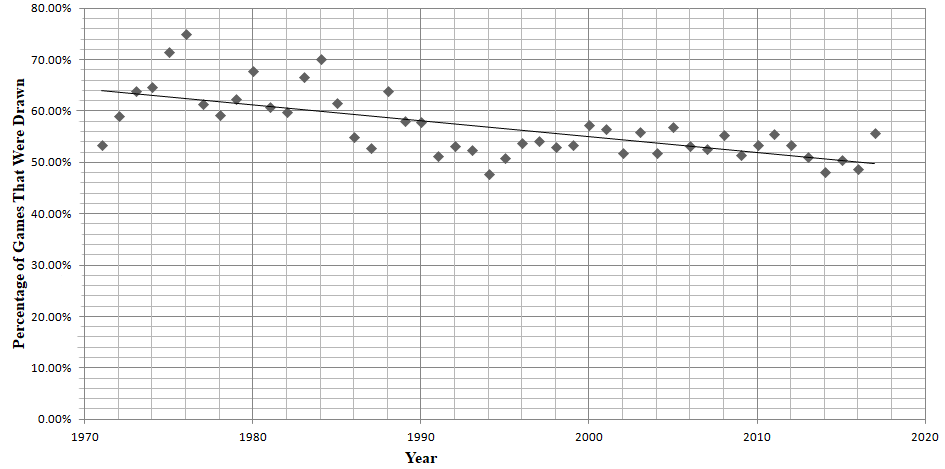
The above table shows the total amount of games played and the rates for draws between the start of 1971 to early August 2017. At first glance, it is evident that the number of recorded games has been gradually rising, although there appears to be no real correlation between the number of draws and the number of games played per year. The data is displayed in a more coherent manner in the scatter plot below:
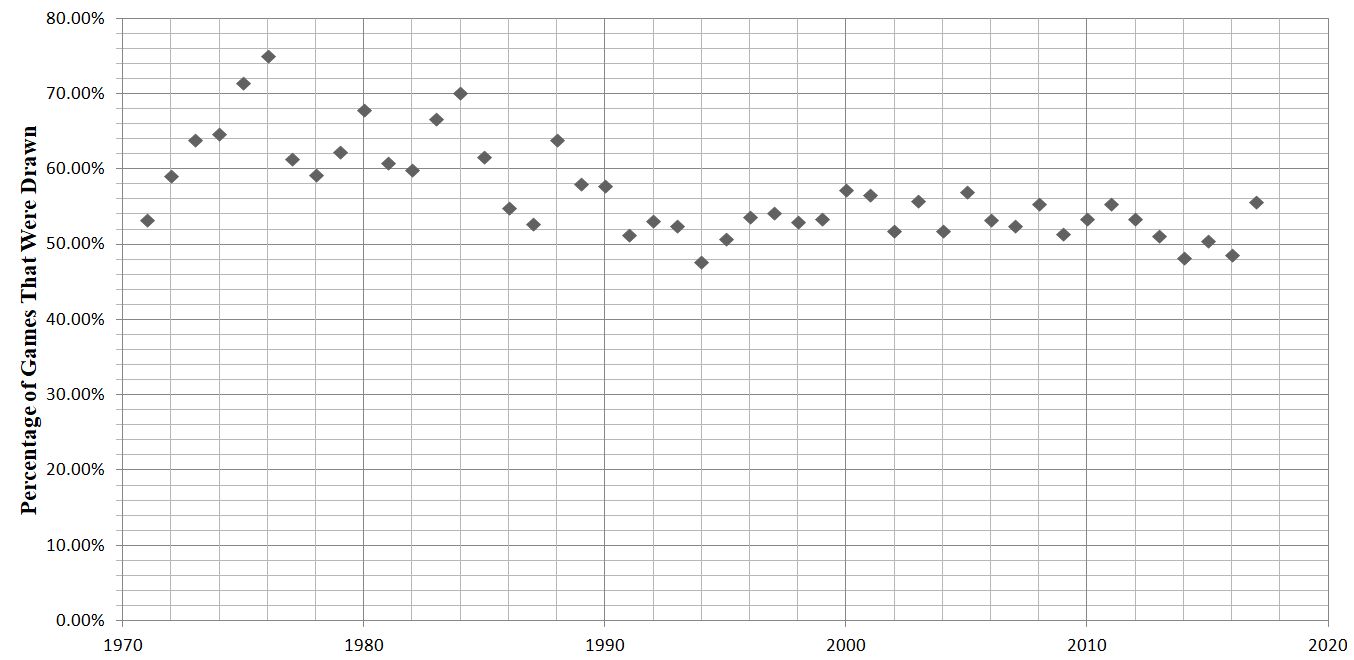
(Click or tap to enlarge)
Firstly, before 1993, the relationship between the percentages of drawn games is insignificant compared with year, as it fluctuates between 52% to 70%. However, after 1993, the rate stays at around 50%. The data is further analyzed using the least squares regression formula, to determine any correlation after the year 1990. This is relevant because, as seen before, there is not a lot of data (refer to the raw data table in the appendix for specific numbers of games collected) between the years before 1993. This signifies that the percentage of draws may be related to the number of games available for analyzing. The number of games collected from before 1993 is lower due to many reasons, such as the lesser number of people playing, as well as the number of organized tournaments. Nowadays, tournaments are organized much more frequently.
Calculations are useful in the real world as they can provide statistical evidence for correlation, averages, and the significance of the relationship of data. For chess, in this case, a line of best fit can visually show the correlation between two variables, which in this case will be the percentage of games drawn to the year.
To find the line of best fit, statistically, the least squares regression formula is used.
y=ax+b
where:
y is the predicted value
a is the slope
b is the y-intercept
Taking the table from above and assuming a linear correlation:
y = –0.0031x + 6.7835
Taking a closer look at the linear regression line starting from the 1990s, in which the number of games went up drastically, it can be seen that the percentage of draws has been fairly even. A reason for the horizontal line for draw rates may be that computers became more popular, and tools for analyzing chess started to appear. Thus, games played became more accurate, with both sides at top levels making fewer mistakes, leading to an even number of draws. In this situation, the slope of the line is given by:
y = –0.0005x + 1.55
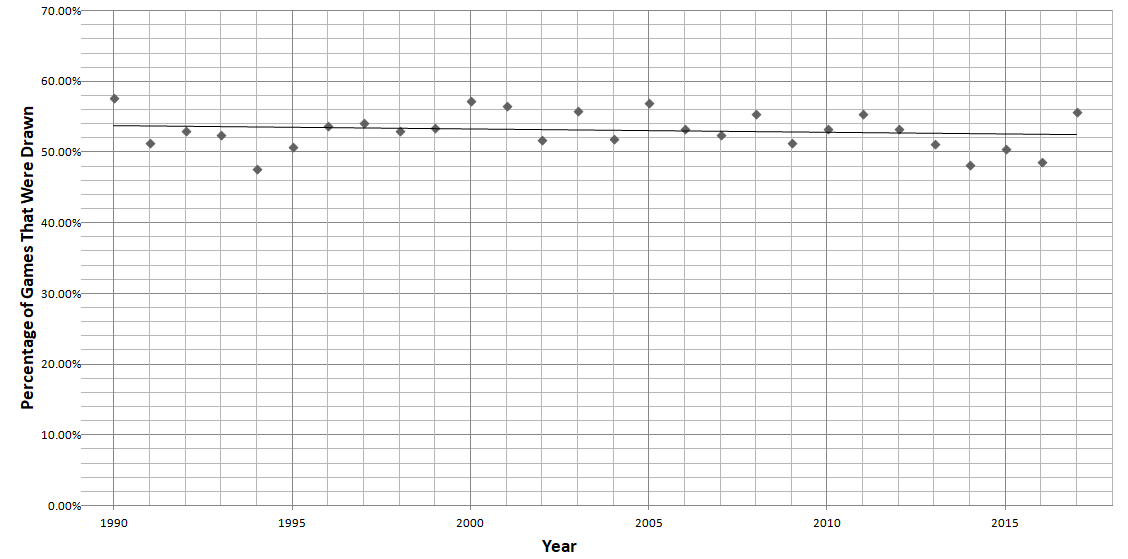
It turns out that the average is fairly close to the line of best fit given by this scenario. This graph once again shows that the number of games collected has not caused the number of draws to rise.
The average is calculated by adding up all the data and then dividing by the total number of data points. The average is convenient for looking at what is the overall percentage of draws and compare each year in relation. In this case, to calculate the average percentage of draws per year:
![]()
where:
![]() is the mean or average,
is the mean or average,
![]() is the sum of all the percentages
is the sum of all the percentages
and n is the total number of years.
Using the data from the table of raw data above, since
![]() = 2674.08% and n = 47
= 2674.08% and n = 47
![]()
![]() = 56.8953%
= 56.8953%
The average number of draws per year can be rounded to 56.90%. This leads to standard deviation, which can be used to further analyse any correlation between the numer of draws.
In statistics, standard deviation (s) is a measure of the dispersion of the data from the mean. It will be used in this case to calculate how close each data point is to the mean. It is expressed as:

where
![]() is the mean or average;
is the mean or average;
x is each individual score;
n is the number of data points;
∑ is the sum of the values; σ is the standard deviation.
A high standard deviation means that the data point is spread out, while a low one indicates that each data point is close to the average. The calculated standard deviation in this situation is 6.3025%, which means that each data point is fairly close to the average. This means that even with more games played, there has been no noticeable rise in the number of draws each year.
Though the previous graphs and data analysis did not prove the hypothesis of the number of top-level games and the number of draws, over the course of the last 40 years and an increasing number of games that are available for research, an interesting trend can be seen in the following graph:

If we graph the number of games collected in a year against the percentage of games that were drawn for that specific number of games collected, we can see clearly that draws are the most common results. However, it is important to look at the y-axis and see the number of collected games for each draw rate. As it turns out, the lower the number of games collected each year, the higher the percentage of draws. This graph appears to be exactly opposite to the hypothesis; increasing the number of games that are available for research has, in fact, lowered the percentage of games drawn. However, it can be assumed that a lack of data may be the reason for the high number of draws.
Quite evidently, the higher the number of games played, the higher the number of draws. This is proven by the linear line of best fit, which shows a direct linear correlation. The previous graph supports the conclusion drawn from this one, which was that an increasing number of games available for research lowered the percentage of games drawn.
While there appears to be no correlation between the number of games played and the number of draws that occur at high-level chess, draws are still the most frequently seen result in the game of chess. Whether or not tournament directors will be able to change this through shorter time controls or other methods is up for debate. However, it can be assumed that only when there is a lack of information, there is a significantly high number of draws at the highest levels. For the years 1971 until the early 1990s, not a lot of games were collected. While there is a high number of draws, it cannot be assumed that the number of games collected is the cause of the number of draws, because of the lack of data. However, from the 1990s onward, the relative percentage of draws each year stabilizes to around 50%. We can, therefore, conclude that with a higher number of collected games, there will be a more consistent number of draws.
I concluded that there is no correlation between the number of top-level games and the number of draws over the course of the last 40 years. Nonetheless, further research could be conducted on the draw rates of lower level players, which would provide an interesting contrast to the data of higher-level players, because at lower levels games are more likely to have a definite result due to the frequency of mistakes. As players in chess are only becoming stronger, it can be assumed that the rate of draws will stay close to the current prediction of 50%.
I am very grateful for the review and feedback I received from Dr. John Nunn, Ken Thompson and Jeff Sonas. Their comments encouraged me to look deeper into the reasons for the trends and to draw a more fitting conclusion about the situation of draws in chess.
 About the author
WGM Qiyu Zhou [pronounced Chee-you Jo], born in 2000, is a Canadian chess player who has competed for team Canada at the Women's Chess Olympiad since 2014 and who won the Canadian women's championship in 2016.
Qiyu learned to play chess at the age of four in France. In late 2004 the family moved to Finland, and Qiyu won the Finnish Youth Chess Championships five times (in 2005, 2007, 2008, 2009 and 2010) in the U10 Open section. Also in 2010, she won the Nordic School Chess Championships in the U11 Open division in Sweden. In 2008, she won the silver medal in the U8 Girls section at the World Youth Chess Championship in Vung Tàu, Vietnam.
In 2011, Qiyu transferred chess federations from Finland to Canada. She won the Canadian Youth Chess Championship in 2012 and 2013, in the Girls U-12 and Girls U-14 sections respectively. She won the Girls U-14 World Youth Championships in Durban, South Africa, 2014.
Also in 2014, Zhou made her debut at the Women's Chess Olympiad in Tromsø, Norway. She played board four for the Canadian team scoring 6½/9 points. In the same year she also took part in the World Youth Under-16 Chess Olympiad in Gyor, Hungary playing board four for team Canada, which finished fifth. She finished first in the U-18 Girls category at the North American Youth Chess Championships in 2015 Toluca, Mexico. As a result, she was automatically awarded by FIDE the title Woman International Master (WIM). In September 2016, Zhou won the Canadian women's championship and as a result qualified to play in the Women's World Chess Championship 2017. You can watch a speech she did on how to achieve one’s goals.


| Advertising |