

In Part one of his article the author compared Fischer's crushing 12.5–8.5 victory over Boris Spassky in their 1972 Reykjavik match to the 15.5–14.5 victory of Max Euws over Alexander Alekhine in 1935 – and to the title wins of FIDE knockout champions like Khalifman, Ponomariov, and Kasimdhzhanov.
In Part two In Part Two Matthew turned his statistical searchlight on Anand vs Carlsen, which will take place in Chennai later this year. Many chess fans expect Carlsen to win. But what are his real chances? Matthew ran 40,000 match simulations, based on previous results, rating and the event format, and came up with precise figures.
I’ve been reading through your feedback, and some of you have raised very interesting questions. For those who are curious about the statistical techniques, there is more detail below. In addition, we have more surprising results and extra coverage of Anand–Carlsen.
Thomas, Berlin
Luckily only computer games are decided by statistics – the WCCh will be decided by nerves, skill and a bit of luck. It is for sure that this will be Carlsens toughest match so far, and he would be ill adviced to underestimate Anand, who has not been at his peak over the last years but will surely mobilize everything he has to win. So – sorry – no reason for me to read this article at all
Bert Houweling, Terschuur, Netherlands
As a mathematician and chess player I especially like the second part of the article. As a mathematician I know that Elo is based on average results against all opponents, and as a chess player I know that there are players who perform better against weaker opponents and others against better opponents. One of the reasons for Carlsen's high Elo is the fact that he manages to create problems for (slightly) weaker opponents, even in relatively even positions. So I think the last part of your analysis is most accurate.
Matt Wilson
If the match ends at 6-6, then they will play four tiebreak games at rapid time controls. If the score is still level, then there is a series of two game blitz matches. My original forecasts estimated the probability of a drawn match, but did not attempt to predict the outcome of the tiebreaker. Can we do this?
FIDE has started a separate list for rapid games, but it is very recent and might not have stabilized yet. In 2012, the initial rapid ratings were set equal to the classical ratings. Since the system is so new, it may reflect the players’ past classical performance rather than their current skill at rapid time controls. I wouldn’t have much confidence in predictions based on these ratings.
But there is one question that we can examine: in their previous 21 rapid games, has Anand outperformed his regular rating when playing against Carlsen? Anand is thought to be even more fearsome at rapid time controls. It is commonly known that his quick intuition allows him to handle the fast pace exceptionally well. But surprisingly enough, Anand underperforms his rating by about 17 points in his rapid games against Carlsen. This is nowhere near being statistically significant, and Carlsen was probably underrated in the older games. But there is certainly no evidence that Anand does better than his rating would predict when he is playing rapids against Carlsen.
I don’t have a reliable estimate of the draw rate for rapid games in the world championship. Instead of presenting a single forecast, I’ll give two estimates under extreme assumptions. The truth will lie somewhere in the middle.
Best case for Carlsen: The assumptions for the second forecast in Part two continue to be valid in the rapid and blitz games. Carlsen has a 92.6% chance of winning the match, while Anand has only a 7.4% chance.
Best case for Anand: He outperforms his rating in the classical games, as in the third forecast in Part two. In the rapid and blitz games, he plays at his rating. The draw rate drops to 40% in the tiebreakers since there are more errors in games with a fast time control (note that a lower draw rate increases the chance of an upset). Anand wins the match 13.3% of the time and loses in the rest of the simulations.
Even Anand’s ideal scenario is rather bleak for him.
Roberto Manunta, Italy
I really appreciated the statistical analysis of Matthew Wilson in both his articles and I would love to know his opinion on a hotly debated topic: were Fischer's conditions fair for his Karpov match? (The match continues until one player wins 10 games, draws not counting; no limit to the total number of games played;
in case of a 9–9 score, the champion (Fischer) retains the title, and the prize fund is split equally.)
Matt Wilson
A fascinating question. Most people would just say, “Of course it’s unfair – the rules favor Fischer.” But to the numerically inclined, the natural response is, “Fischer is favored, but by how much?”
First we need to define a fair match. The rules should be designed so that if the two players are equally skilled, then they each have a 50% chance of becoming world champion. Note that in the modern era with a 66% draw rate, the match will likely be quite long. I estimated the number of games with 10,000 simulations:
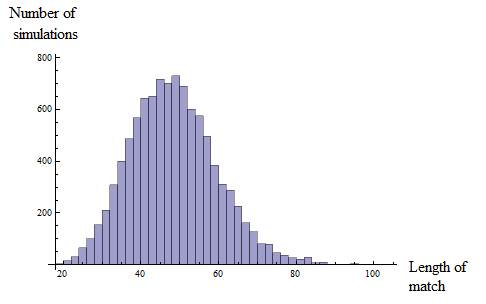
The ten win system worked fine back in the early world championships, since wins occurred so frequently. To analyze this for 1975, we’ll need a couple of big assumptions.
Big assumption #1: the organizers will allow the match to continue regardless of how long it takes.
Big assumption #2: the draw rate will be unaffected by the length of the match. Naturally the players may tire as the match wears on, but this doesn’t necessarily change the draw rate. This assumption is hard to test since there isn’t a historical match of comparable length. The matches in modern times that went past 24 games are too small of a sample for me to have any confidence in the results.
Result: if the players are equal, then the match ends in a draw 18.5% of the time, more precisely
Thus, the world champion keeps the title in 59.3% of the simulations even though he is no better than his opponent!
We could also ask, “Is this more unfair than the traditional 24 game matches where the champion had draw odds?” In 24 game matches with players of equal strength, 13.9% of the simulations end 12-12. The champion retains the title 57.0% of the time.
Under Fischer rules, the narrowest possible victory for Karpov would have been ten wins to eight wins, while Fischer only needed nine wins to nine wins. This seems quite unfair to Karpov, and it is. But surprisingly enough, it is only slightly more unfair than giving the champion draw odds in a 24 game match. And it is about equally unfair as the deal Leko got in 2004 (14 game match with draw odds for Kramnik).
(For my fellow math enthusiasts: A match of m games with a 66% draw rate ends in draw with probability
if m is even and the players are equal.)
Jon Crumiller, Princeton, New Jersey USA
The article doesn't take into account one very important fact: match strategy dictates that one's approach to games later in the match are based on the score at the time. So whereas 12.5-7.5 definitely indicates superiority, so does 11.5-8.5 (or even 11-9) because a player with a three-point advantage (or two-point advantage) is going to play more solidly and take fewer risks. Draws are more likely in that situation, because the superior player, playing solidly, is far less likely to lose. The analysis doesn't take any of this into account.
Matt Wilson
A claim worthy of investigation! However, we saw in Part one that factors that affect the players psychologically don’t necessarily affect the outcome. I found that the draw rate was unaffected by whether or not a player won the previous game. And though it true that the player in lead has an incentive to play safely and try to force a draw, it is also true that his opponent will be extra motivated to win. But your claim is quite plausible, so we should see what the data has to say.
This strategy only makes sense in matches that aren’t governed by the six win system. Therefore I’ll exclude the Karpov-Korchnoi matches from consideration, as well as Karpov-Kasparov 1984. Also, once a player has a large lead, he always has an incentive to draw, whether or not it is late in the match. To get a large enough sample, I’ll focus on matches where one player had a lead of at least two points.
The big question: In games where one player has a lead of at least two points, in a match that is not the six win system, is there a significantly higher draw rate? In the modern era (defined to be 1966 – present in the article), games meeting those criteria had a draw rate of 67.8%. It turns out that this is not significantly higher than the draw rate in other modern matches. The result is the same in the 1921 – 1963 matches. Therefore there is not enough evidence to reject the assumptions I used in the model.
Julio Kaplan, El Cerrito, California, USA
Interesting analysis. I would caution against the underlying assumption that the purpose of a World Championship match is to determine the better player, beyond any doubt. Chess is served well by shorter matches, and even the "wrong" results, and the increased chance that they will occur, can help the game. All we need is for either player to be worthy of the title.
Tom Welsh, Basingstoke, England
Thanks for publishing Matthew Wilson's excellent and highly interesting articles. He shows that the traditional 24-game matches for the World Championship were in fact well suited to determining the better player. However we have seen a rapid flight in the other direction: to shorter matches that cost less and are thought to be more appealing to media and the audience. That this system is far less appropriate, and indeed introduces a huge element of chance, doesn't seem to matter. I also wonder why rapid chess games are ever used to decide a classical time limit match. It's as if the winner of the US Open tennis tournament were to be decided by a game of ping pong! Perhaps with so many very strong players – and always bearing in mind that the best computer programs can slaughter them all anyway – it just doesn't matter very much who wins the title?
Tim Bogan, Chicago, IL
So now a statistician has mathematically proven what anyone who has any knowledge of chess history has known all along: twelve game matches for the World Chess Championship are a joke, not worth even having them, a waste of time. Bring back the twenty-four game matches, and restore chess to the glory of the fantastic battles waged by Botvinnik, Smyslov, Tal, Petrosian, Spassky, Fischer, Karpov, and Kasparov!
Matt Wilson
Unfortunately, the 50 Point Principle offered in Part two doesn’t seem to be catching on. I prefer 26 game matches with a two game tiebreaker played at classical time controls. If there is anything good about the twelve game matches, it is that at least FIDE has been consistent with it over the last several cycles. Consistency matters, since match length can be manipulated to improve one player’s chances while appearing to be fair. An example illustrates:
Suppose it’s 2011, and that I’m a high ranking FIDE official with questionable ethics. Perhaps I want Anand to win. How can I use my position to help him? He is scheduled to play Gelfand, but we’re confident that Anand is the better player. To reduce the chance of an upset, I would lobby for a long match.
Now it’s 2013. I still want Anand to win, but I’m afraid that Carlsen is the stronger player. Now I’ll argue for a short match in order to increase the scope for luck. This would improve Anand’s chances.
To its credit, FIDE doesn’t seem to have tried this idea. If only we could get them to use matches that are long and consistent instead of short and consistent…
G.Wuthrich, France
I have to react to this. Reading this "statistical study", if you'll excuse me, it reminded me how I always felt econometry is as close to applied statistics than cooking is to chemestry. Play 30 games with Alekhine, win by one point, call it luck. Please, replace the word luck about everywhere in the article.
In statistics, to test hypothesis with models based on quantiles simulations, one first has to make sure the model that generates the quantiles is fine, and has to be somehow tested (validated). I won't get into details, but the two matches that are taken as main examples are not even of the same format, though close I admit, and this is something that has an impact on how the match develops, how the score ends... This final score being a very highly sensitive, versatile input in the final decision of the test constructed.
The "statistical study" presented here in fact only tests if the match result was close or not, in a very discussable way, and there was no need of statistics for that.
Julian Wan, Ann Arbor, MI
Matthew Wilson's article Part one is interesting as it is based on a statistical method widely used in medicine when comparing two treatments. Is one actually better than the other in curing disease, prolonging life or ameliorating symptoms? It is an interesting article and helps quantify why Fischer's run to the title remains so impressive. It might be worth noting that his work suggests that Euwe's victory of Alekhine in the first match was as decisive as Fischer's, but a deeper point is that the result cannot be dismissed as improbable. Going into the match Alekhine was heavily favored and so his loss was considered a major upset. Few if any fans predicted Euwe's victory. In the return match, the analysis showed that the two players were no longer similar to where they were in the first match - it could be as easily said that Euwe was worse as much as Alekhine was in better form – history and logic tells us the latter is more likely. Interesting article!
Matt Wilson
I first wondered how to run statistical tests for chess back in summer 2009. At the time I was taking a probability class, so I talked to the professor and one of my classmates. Sure, it’s easy to perform tests for games that are win/loss – that’s what the binomial distribution is for. But what do we do when draws are also possible? We didn’t figure it out, so I forgot about the question for a while.
After surviving a year of grad school, I asked an econometrics professor. He couldn’t think of an answer off the top of his head. But then I thought of something. Instead of trying to make the binomial work, let’s just use average points per game! Then we can plug the results into standard statistical tests for averages.
But I was too busy to implement my plan. I revisited the question this July and spotted a subtle flaw. The standard tests for averages require a random sample of N observations, where N is a whole number. However, for matches the sample size is not fixed. For example, the 24 game match need not last 24 games; it ends as soon as one player scores 12.5 or 13. Also, for matches such as Karpov-Korchnoi 1981, the number of games is potentially unlimited (they played until one player scored six wins), so once again the sample size is not constant.
Does this mean that we can’t perform any statistical tests? No. From my second year of grad school: “When in doubt, simulate it!” Recall the basic setup for a statistical test: we start with a null hypothesis – in this case, it is that the players are equally skilled. If the null really were true, how likely is the result that actually occurred? Usually the answer comes from charts and tables for standard tests. But an equally valid approach is to run simulations. We write a program that includes all the assumptions of the null hypothesis. Then after a large number of simulations (such as 40,000), we can accurately measure the likelihood of the real world outcome, assuming that the null is true. If that likelihood is low, then there is evidence to conclude that the null is wrong. It is similar to an indirect proof: to show that the null is false, assume that it is true and demonstrate that it struggles to match the data.
So how do the simulations account for the fact that the match length can vary? The computer needs to stop the match at the right moment. For the traditional 24 game match, that would be when one player reaches 12.5 or 13 points, or when the score is 12-12. Define “total(n)” to be Player 1’s score after n games. For instance, if he drew the first game and won the second, then total(1) = 0.5 and total(2) = 1.5. It is easy to see that his opponent’s score must be “n – total(n)”. The simplified computer code is:
n = 12; While[Max[total[n], n - total[n]] < 12.5, lastgame = Min[n + 1, 24]; n++]
This may look complicated, but the basic idea is fairly straightforward. Starting from game 12, the program checks if either player has reached more than 12 points. If one of them has, then the match stops. If neither player has more than 12 points, then the program checks the next game. This process repeats until one player wins or until the game 24, when the match has to end.
In one of the comments above, a reader correctly observes that the Euwe–Alekhine match had a different format, and that this could impact the results. The rules stated that the winner had to win 6 games and score more than 15 points within 30 games. But my program accounted for this. I had rewritten the computer code for when the match ends:
n = 6; While[Max[wins[n], losses[n]] < 6 \[Or] Max[total[n], n - total[n]]
< 15.5, lastgame = Min[n + 1, 30]; n++];
In English: if one player has more than 6 wins and 15 points after game n, then the match ends. Otherwise it continues to the next game, but it cannot go past game 30.
Matches with the six win system were dealt with in a similar fashion. The only problem is that the number of games could be infinite. But in practice, organizers and players have finite patience, as seen in Karpov–Kasparov 1984. After 48 games failed to produce a winner, FIDE president Florencio Campomanes halted the match. In the simulations I assumed that matches with the six win system would not last longer than 48 games.
Now for the calculation of the p-value.
Paul Leyderman, Chicago IL
I think all the p-values Matthew Wilson quoted are twice of what they actually should be. This is especially glaring in the Euwe-Alekhine example. “It turns out that if two equally skilled players play a match under the same conditions, a victory at least as good as Euwe’s will occur 88.3% of the time” – yes, this is true. But the null hypothesis that should be tested here is whether Euwe is stronger than Alekhine, not whether one of the players (Euwe or Aleknine) is stronger than the other one. So, under assumption that they Euwe is not stronger, his win with the score of 15½-14½ or better would occur 44.15% of the time (and 44.15% of the time Alekhine would win, and 11.7% of the time the match would end in a draw). The relevant p-value here is 44.15%, not 88.3%. Bring back Jeff Sonas! :)
Matt Wilson
The p-values in the article are not doubled. When the null hypothesis is rejected, we need an alternative hypothesis to turn to, and this is where the disagreement lies. My alternative is "Euwe is better than Alekhine or Alekhine is better than Euwe" (a two-sided alternative) while his is “Euwe is stronger than Alekhine” (one-sided).
To apply statistics properly, we should form our hypotheses before seeing the results – or in this case, as if we haven’t seen the results yet. Before the match begins, we don’t know which player will win. Therefore, the alternative should be “Euwe is better than Alekhine or Alekhine is better than Euwe." If we get to look at the results first and only then form a hypothesis, then every alternative hypothesis would be one-sided instead of two-sided.
One-sided alternative hypotheses are used if, prior to seeing the results of the experiment, you have good reason to believe that there is only one other outcome if the null is rejected. An example: I wanted to refine my predictions for Anand-Carlsen by forecasting the outcome of any tiebreak games. Initially it doesn’t seem likely that Anand will underperform, given his outstanding reputation as a rapid player. Therefore, we only expect there to be two possibilities. Either Anand performed as his rating would predict in rapid games against Carlsen (the null hypothesis), or he performed above his rating (the alternative). The result was definitely a surprise.
A more technical letter on the p-values:
Stefan Boehringer, Leiden University Medical Centre
The article recently published on chessbase.com from Matthey Wilson seems to contain several errors and inaccuracies.
A first remark concerns the method of calculation and the actual numbers. The "P-value" for the 6-0 result of Fisher cannot be correct. The result that no game was drawn has probability .33^6 and that each game was won by one side was .5^6. This give roughly a probability of 2.4E-5 not 1.6E-3 as stated. While this can be attributed to the use of simulations (with not enough accuracy) a little thought shows that a simple formula can be attained to calculate the probabilies: We consider all possible sequences of games where K or more games were won by either side, where K is the score achieved by one side. Let us call that number i. For each of these sequences we have to restrict to the ones where no more than i - K games were lost by one side with a winning probability of .5. This can be summarized by the following R-code:
g = function(N, K, drawrate = .66) sum(sapply(K:N, function(i)dbinom
(i, N, 1 - drawrate)*pbinom(i - K, i, .5)))
After pasting this line into the R-console we can re-caculate probabilities from the article:
g(6, 6)
is the probability that in a sequence of six games (first argument) the score of 6 was achieved by one player. The third optional parameter is the drawing rate defaulting to .66. g(20, 5) gives .24 instead of .08 as stated in the article. It seems to me that the simlations contain an error (I might have made an error also, but the 6-0 probability cannot be correct). While simulations are helpful and easy to perform formulas can give more insight when it is possible to use them (and can sometimes be even faster to implement).
The second remark is about the interpretation of these probabilities. The author alludes to "P-values" which pertains to statistical testing. In our case we start with the so-called null-hypothesis that players are of equal strength. We would like to show that this is untrue (rejecting the null-hypothesis). We do this by calculating the probability of the observed data if the null-hypothesis was true. We interpret the resulting probability as the probability of making an error if we reject the null-hypothesis, in our case assuming that players are of unequal strength (had the null-hypothesis been true we had that chance of observing the data). A widely adopted arbitrary cut-off for this error probability (so-called type I error) is 0.05 but often scientific standards require lower probabilities. However, if we decide we could not meet our cut-off (which was vaguely chosen to be 0.1 in the article) it does not mean that the null-hypothesis is true, namely that players were of equal strength. In fact we know a-priori that they cannot be exactly equal, only very close. The problem is that we observe too few games to detect differences between players (we lack power in statistical terminology). This is precisely why systems like Elo were invented to be able to use more data, namely games played within a group of players, to get accurate comparisons between players (at the cost of making more assumptions). Using the setup of the article the author is therefore able to decide in some cases that one of the player is stronger than the other (with a certain error probability). The original question, however, was different: what was the chance of a given player to win the championship? This would be the probability of a positive score in a series of games for the true win/draw/loose probabilities.
I am somewhat inconclusive about articles with statistical content on ChessBase. While they might provide entertainment to some, I found all of the ones I have read (several on the Elo system this year) to be statistically inaccurate if not errorneous, something I would like to bring to attention of your readers.
Matt Wilson
Regrettably, there is indeed an error in the p-value for Fischer’s 6-0 scores. However, it should be 0.0048%, not the 0.16% given in Part one nor the 0.0024% suggested above. The reason why it is 0.0048% instead of 0.0024% is because there are two ways to reach 6-0: either Fischer wins 6-0 or his opponent wins 6-0 (again, this uses the two-sided alternative hypothesis). Thus, the probability is (2)(0.17^6). I didn't use the simulations to reach the erroneous 0.16% – I did that one by hand since it seemed easy.
Stefan’s R-code has a neat trick that allows him to use the binomial distribution. The binomial can only handle win/loss data, so he interprets the result of a chess game as drawn/not drawn, and the null is that the not-drawn games are split equally. Can the code be fixed, allowing the use of the binomial?
Unless he has another trick, the answer is no. The flaw is not at all obvious. Since a 24 game match ends as soon as one player exceeds 12 points, the winner of a match cannot lose the last game. If the winner scores 13 points, then the winner must have won the last game. The binomial does not account for this. Because these restrictions are ignored, it misstates the p-value.
For the second remark, the idea that the players can be close but not equal does not come from the data. Rather, it comes from an additional assumption about the distribution of playing strengths.
Thanks for all the interesting comments. Let me thank my sources: FIDE, chessgames.com, Mark Weeks, Mathematica 9.0 Student Edition, Scid database, and an anonymous individual described to me as “an external brain.”
 |
Matthew Wilson is a PhD student studying Economics. He graduated from the University of Washington in 2010 with a B.S. in Economics and a B.A. in Math, and then earned an M.S. in Economics from the University of Oregon. He works as a teaching assistant at the University of Oregon, where he has taught applied statistics (econometrics) and economic theory. Currently his research focuses on macroeconomic theory and rational choice. In chess, he used to be a promising junior, tying for first place in the Washington State Elementary Championships (grades 4-6). He frequently appeared in Washington's top ten and the USCF's top 100 for his age group. But now there is not as much time to study chess, and his rating peaked at 1952. |