Part 2
1.e4 vs. 1.d4: Controlling for the rating gap
The task at hand: we saw last time that White tends to play e4 when he is lower rated than Black and d4 when he is higher rated. Thus, it isn't clear if d4's higher percentage score comes from it being the better move or from White being the better player. If we can explain the graph below, we can account for the effect of rating (here "rtg_gap" = White's rating – Black's rating, and "avgscore" = White's average score). Then any remaining difference in percentage scores would be due to either e4 or d4 being the better move.

In his well-known book, Arpad Elo said that there is not much reason to adjust the ratings for whether you played White or Black. Since everyone plays both sides about equally often, any biases in the formula would cancel out. Thus, devising a color-adjusted rating system would increase the complexity without doing much to improve the results. Elo may have been more correct than he realized.
The most natural approach for developing a "color-adjusted expected score" is to take Elo's formula and simply add a few percentage points to the White player. Define "overperf" to be the difference between the actual score and this new expected score. If this new expected score is accurate, then it should line up well with the actual score. Thus, "overperf" should just be randomly clustered around 0. We can draw a graph to check if this idea works.

Unfortunately, there appear to be systematic biases. For instance, when the rating gap is -100 (i.e., White is 100 points lower rated), White consistently scores above expected – "overperf" is above 0. Note that this does not prove that there is a problem with Elo ratings. It is quite possible that the formula is right on average over White and Black games, while being biased when focusing only on White's score. It just means that the right formula for us is more complicated than tacking on a few extra points to the player who had White.
After trying a large number of functions to explain the first graph, I began to wonder if there were more factors than just the rating gap and e4/d4. Some evidence suggested that the players' average rating was also important. The online ChessTempo database shows us how much White outperforms his rating.
| Both players rated at least |
Performance rtg - avg rtg |
|
|
e4
|
d4
|
|
2200
|
38
|
38
|
|
2300
|
40
|
41
|
|
2400
|
42
|
44
|
|
2500
|
43
|
45
|
|
2600
|
46
|
44
|
|
2700
|
44
|
39
|
So when both players are 2200+, the advantage of the White pieces after 1.e4 is equivalent to the advantage of an extra 38 rating points. When both players are 2300+, this benefit grows to 40 rating points. If we exclude games between 2700 players, there is a clear trend: as the players' average rating rises, so does the advantage of having White. This result makes sense. As the skill level increases, the number of random blunders falls. Thus, the benefit of having the first move becomes more prominent. There are fewer mistakes to obscure White's plus. But among 2700 players, the skill level is so high that Black holds a draw instead of crumbling under pressure. Playing White has less impact on the results.
So we need to account for the rating gap and the average rating (from here on, "average rating" refers to

The test we did in Part 1 neglected this, so the results may have been flawed. Let's draw a graph to see what is going on. I cut the data up into bins of 50 points based on average rating – one bin is 2200 to 2249, the next is 2250 to 2299, etc. Within each bin, I divide the data into further bins based on the rating gap. So within average rating = 2200 to 2249, there is a bin for a rating gap of 0 to 49, a bin for 50 to 100, etc. Now let's look at the average percentage score for White in each bin.
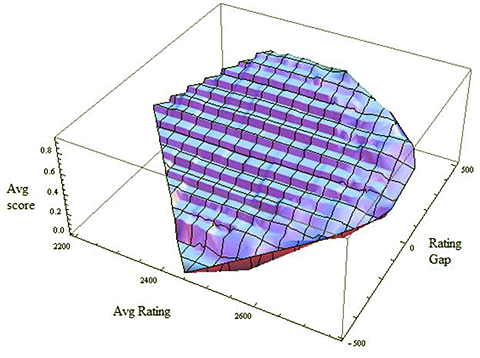
To get a feel for the effect of average rating, we can look at the same data in a different way:
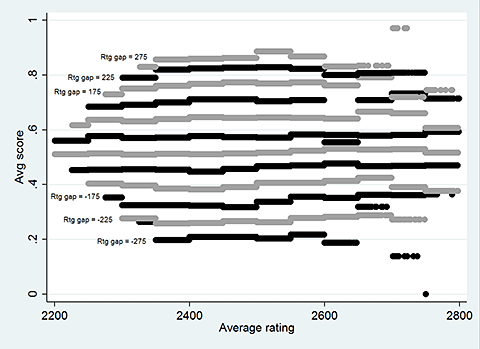
There appears to be a very slight upward trend: as average rating rises, the average score rises as well. This is similar to what we saw in the ChessTempo database. The games with average rating above 2700 can be outliers and were problematic in the analysis, so I excluded them. But even after this more careful approach, issues remained. What other variables could there be to consider?
One strange variable kept cropping up: the rating gap multiplied by the average rating. It almost always passed tests of statistical significance, even after everything else was accounted for. But it didn't seem to make any sense. Why would the rating gap matter more when the average rating is higher?
When analyzing games, we can loosely classify errors into two categories: random mistakes and mistakes made under pressure. Random mistakes can occur in any position. However, it seems that blunders are noticeably more likely to occur when defending a difficult position. Even 2700 players screw up when faced with the pressure that Magnus Carlsen applies. We know that as the average rating increases, White scores better since random errors decline. When the average rating is high and White is higher rated, the pressure from defending Black is combined with the pressure exerted by a stronger opponent. Thus, the rating gap multiplied by the average rating could be significant in explaining White's percentage score.
Putting it all together: White's percentage score depends on* (See footnote)
- The difference in the player's ratings
- The players' average rating
- The rating gap multiplied by the average rating
- e4 or d4
And the result from Part 1 is overturned: whether White played e4 or d4 is very much statistically significant (p-value = 0.0086) once these other factors are accounted for. However, the practical significance is not so great. The coefficient on the e4 variable is 0.002. What this means is that if you switch from d4 to e4 in your next 1000 games as White, you would score 2 more points – hardly worth the effort of rebuilding your repertoire. I experimented with several other models that accounted for the rating gap and the average rating, but tended to get the same results. Leaving out the rating gap multiplied by the average rating didn't change much. The only difference is that e4 might boost your score by 0.20% instead of 0.22%. I also explored whether the effect of e4 could differ depending on the rating gap or the average rating (e.g, is e4 only better when the rating gap is large?). It wasn't.
One final check: what about transpositions? Not every d4 game begins with 1.d4. To quote just one example out of many, Fischer played 1.c4 against Spassky and arrived at the Queen's Gambit Declined after 1…e6 2.Nf3 d5 3.d4 in Game 6 of the 1972 World Championship. If we include games that transpose into d4 or e4, does that change the results? Fortunately, we can answer this question by searching for games using the ECO code rather than the first move that was played. I also considered games transposing into the English or the Reti to get additional comparisons.
The main result is unchanged: e4 still scores 0.2% higher than d4 after all the other considerations are factored in. This remains statistically significant (p-value = 0.0065). The inclusion of English and Reti games provides some additional insights. 1.d4 scores 1% higher than 1.c4, and c4 in turn scores 0.8% higher than 1.Nf3. All of these differences are statistically significant.
There was one unusual result when the ECO classified data was used. To be careful and avoid leaving anything out, I tested whether the year that a game was played in could impact its result. Much to my surprise, it was significant and had a negative effect on White's score! But after some reflection, this makes sense. As opening theory progresses, Black's defenses improve and diminish the advantage of the White pieces. We are fairly sure that a perfectly played game will be a draw, so the development of theory should gradually erase White's edge. However, fears that the opening is being played out and chess is being exhausted seem exaggerated: White's percentage score drops by only 0.01% per year. We have another 400 years to go before White's edge is eliminated J , and there isn't any evidence that White's decline is accelerating. This may be a further surprise: shouldn't theory be evolving more rapidly in the computer age, driving down White's results at a faster rate? Apparently the progression of theory is only imperfectly correlated with White's score.
White's expected score from playing 1.e4 in 2014: A 3D graph...
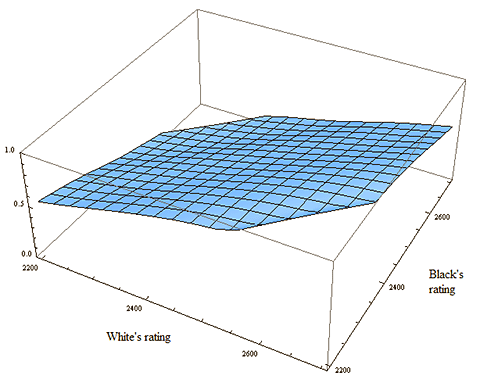
…and a 2D contour map:
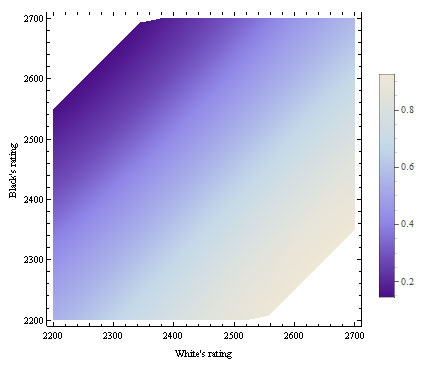
So Fischer was right that 1.e4 is "best by test". However, only the most fanatical competitor would be willing to overhaul his repertoire to score an additional 0.2% per White game; the result has little practical significance. The advantage of the White pieces is higher when the players are highly rated, and is especially important when White is also the higher rated player: the combined effect of the average rating and being the stronger player is more than the sum of these effects individually. However, Black's disadvantage is very gradually shrinking over time. But the rate of decline is so slow that I don't see any need to switch to FischerRandom or change the rules in order to avoid the ever increasing reach of opening theory.
*Footnote: More precisely, the result in game i is:

Here  is a random error, and the "e4" variable equals 1 if 1.e4 was played and 0 if 1.d4 was chosen instead. A large number of models were tried, but only this one stood up to scrutiny. The sample was 673,041 games. Games were included if both players were above 2199, the average rating was below 2700, and the rating gap was between -350 and 350 (remember that the rating gap = White's rating – Black's rating, so it can be negative).
For the ECO classified data, the model is:

The same criteria for which games were included was used, except that English and Reti openings and transpositions were also accounted for. The sample was 822,945 games.


